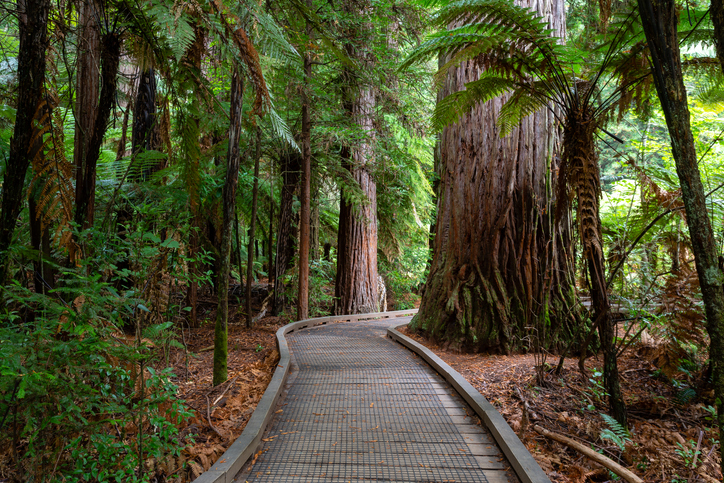
Redwood - Spatial productivity indices
Whenua
Forestry
Productivity
Discover how well coast redwood could grow and yield timber on your whenua.
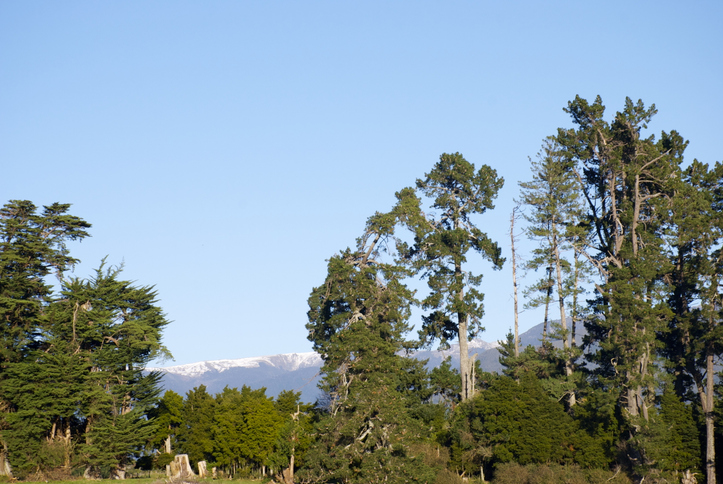
This dataset maps how well two cypress species, Cupressus macrocarpa and Cupressus lusitanica, could grow across Aotearoa, feeding a cypress growth model.
It gives two measures: a 300 Index, the wood volume the trees put on each year at age 30, and a Site Index, how tall the trees reach by age 30. A higher number means faster-growing, more productive trees.
Scion built the surfaces from measurements at more than 150 plots of each species around the country, matched statistically to the temperature, rainfall and soil conditions at each plot and then mapped nationally. The maps are a guide for choosing where to plant, and weigh up the conditions of your own site as well.
Discover how well coast redwood could grow and yield timber on your whenua.
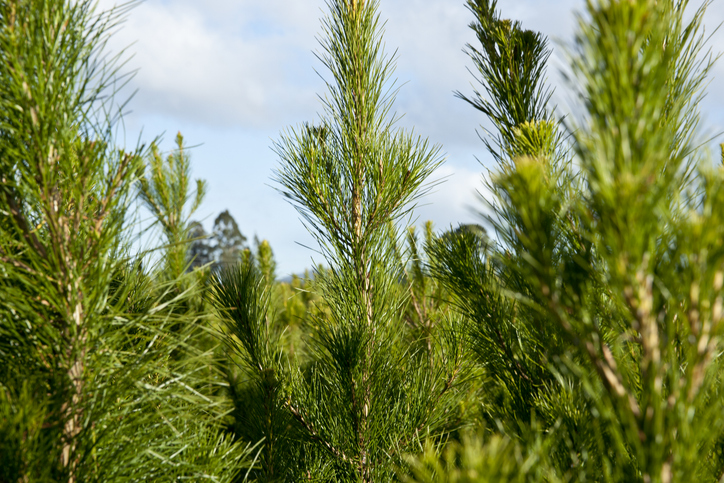
Find out how well radiata pine could grow and yield timber on your whenua.
Model and manage the growth of kauri plantations on your whenua.
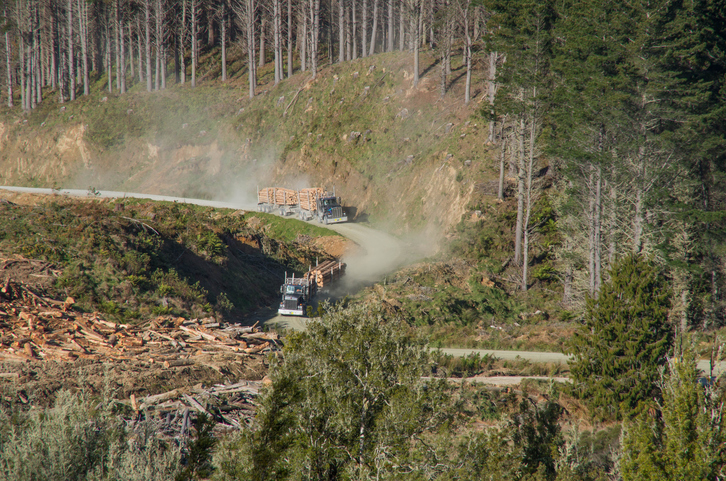
Compare how much carbon radiata pine could store on your whenua by age and stocking.
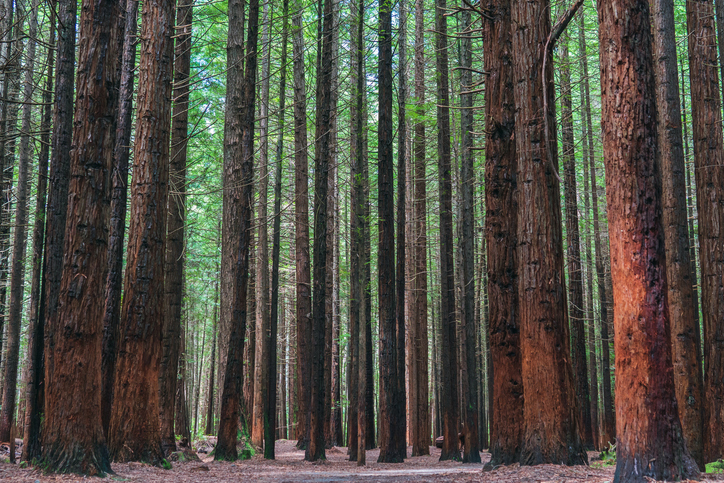
See how much carbon coast redwood could store on your whenua by age and stocking.
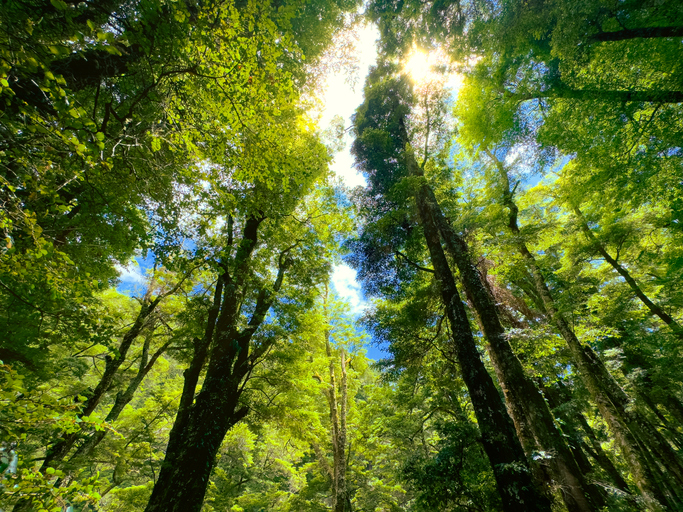
Learn how well-managed native forests can absorb significant amounts of carbon.
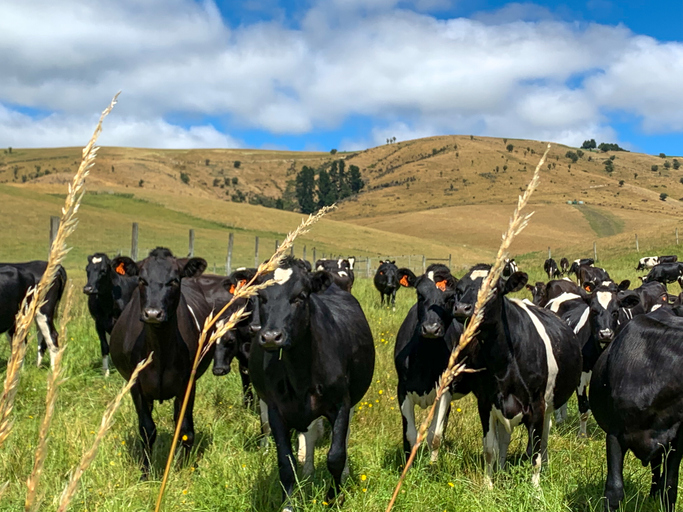
See how many hot days dairy cows in your rohe could face as the climate warms.
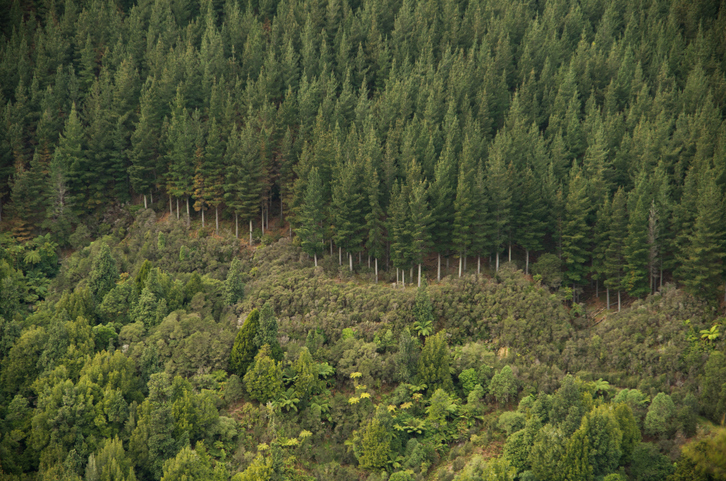
Explore how suited your whenua is for planting radiata pine as a forestry crop.
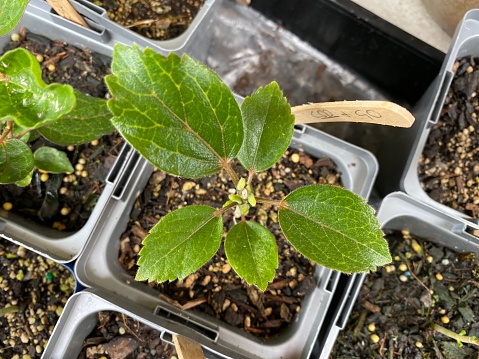
This guide can help you choose the right tree species for forestry on your whenua.
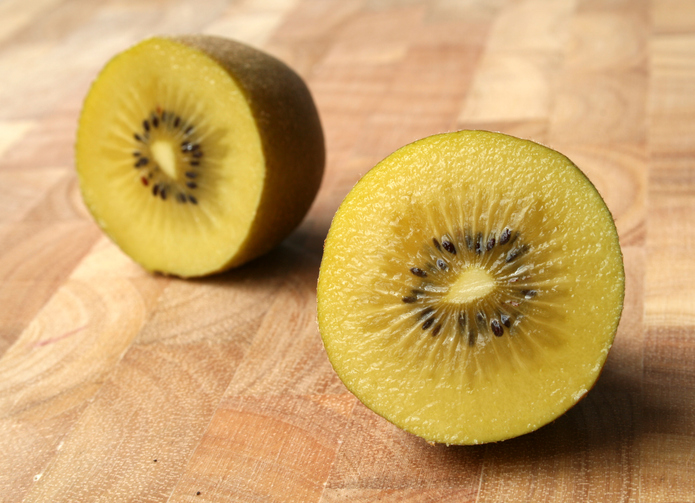
See how many jobs gold kiwifruit could support on the whenua in your rohe.
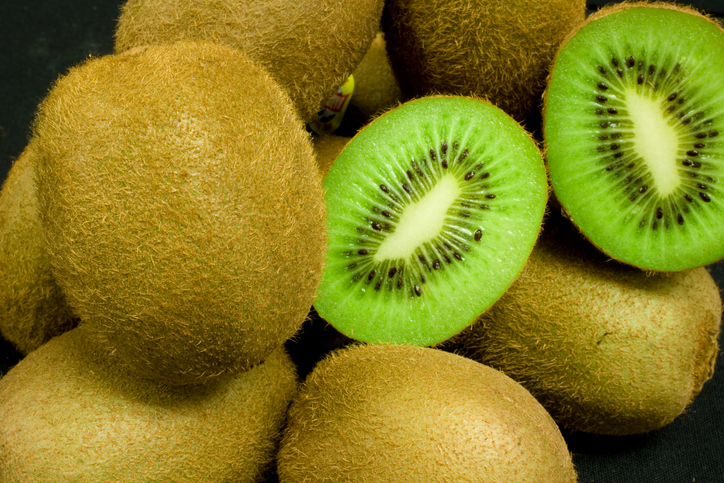
Discover how many jobs green kiwifruit could support on the whenua in your rohe.
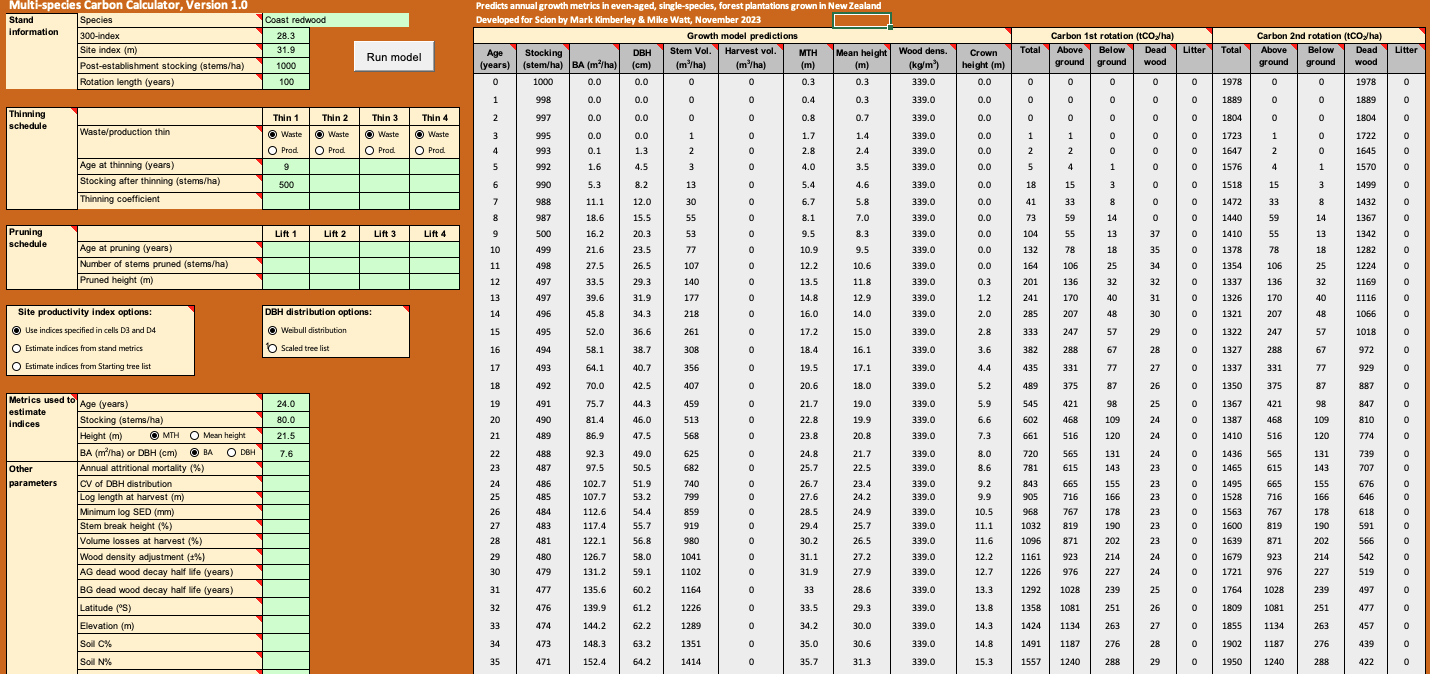
Calculate forest growth and carbon for New Zealand tree species using data about your whenua.
Look up expected carbon stock by forest age for small forests in the ETS.
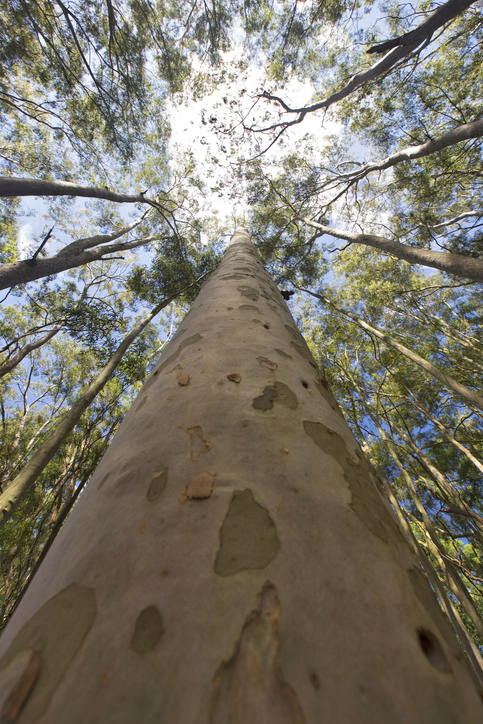
See how suited your whenua is for planting Eucalyptus fastigata as a forestry crop.
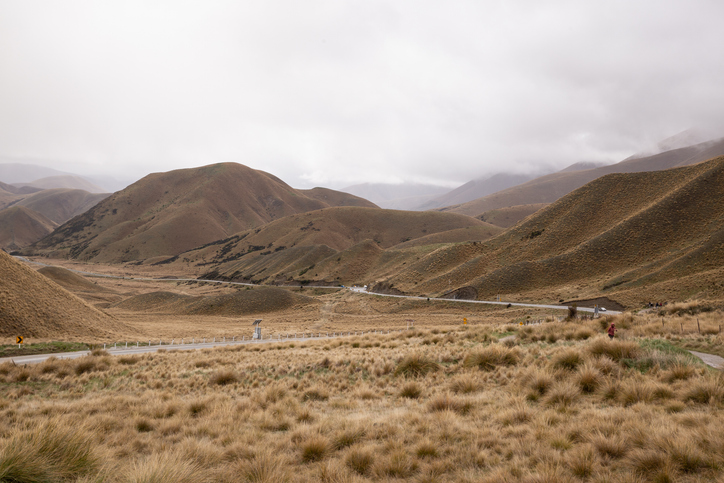
Find out how pasture growth on your land could change as the climate warms.
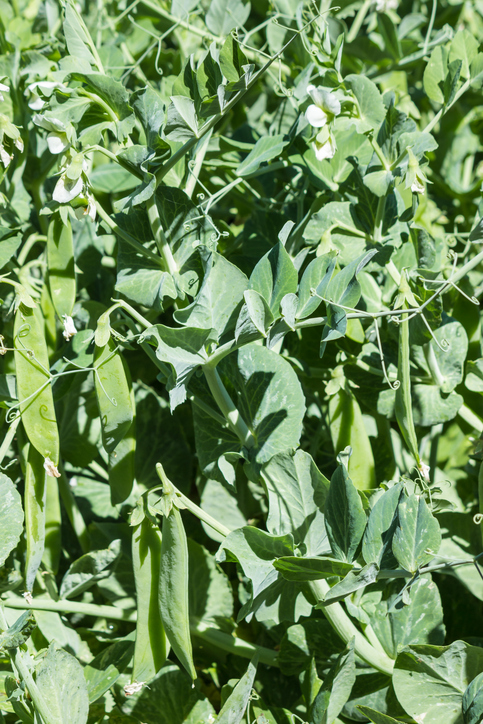
Learn how much peas the whenua in your rohe could produce each year.
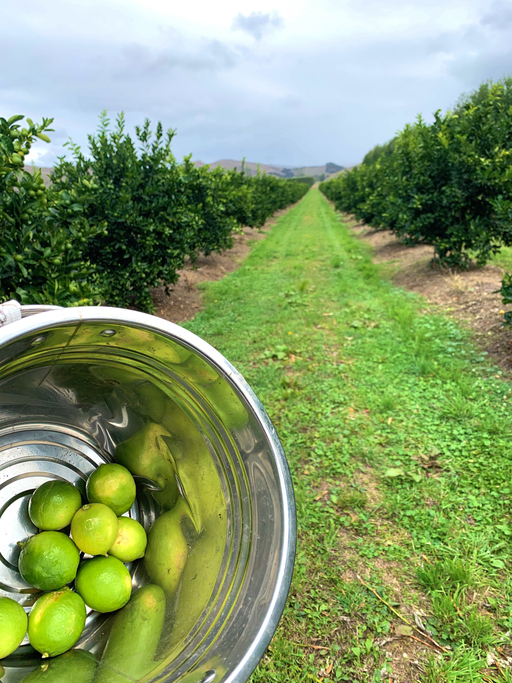
Check how much citrus the whenua in your rohe could produce each year.
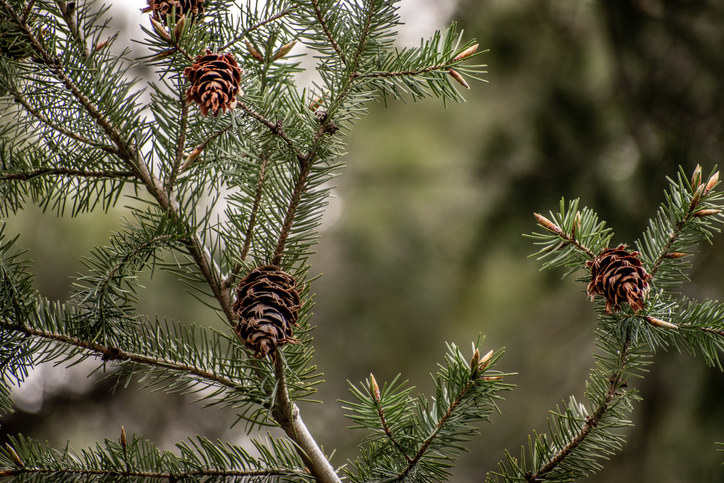
Check how suited your whenua is for planting Douglas fir as a forestry crop.
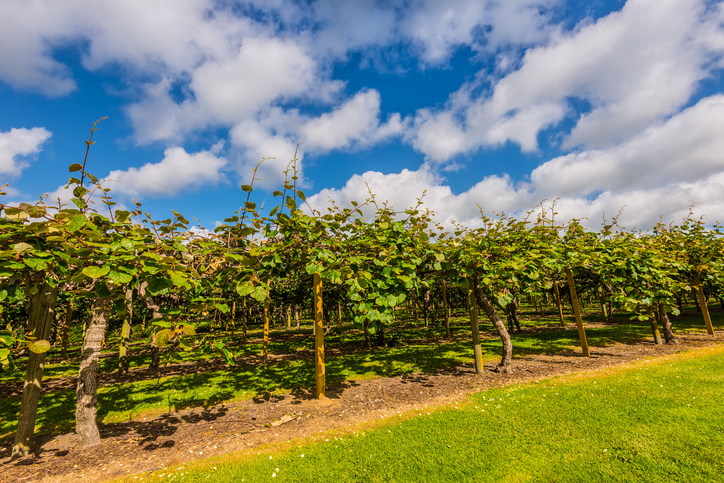
Find out how much kiwifruit the whenua in your rohe could produce each year.
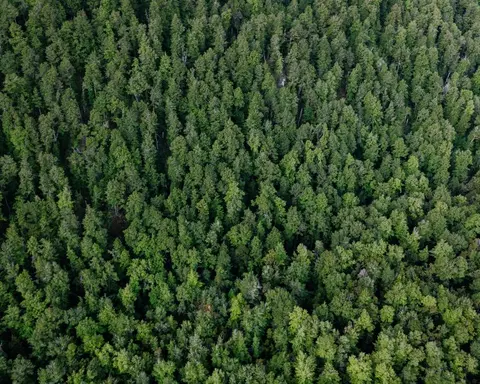
Find growing notes for 15 iconic tall natives, including kauri, rimu and tōtara.
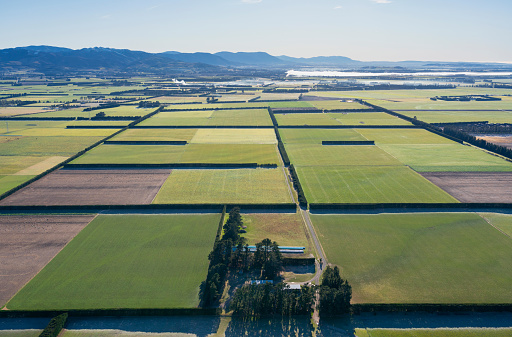
See how much pasture your land could grow under different irrigation choices.
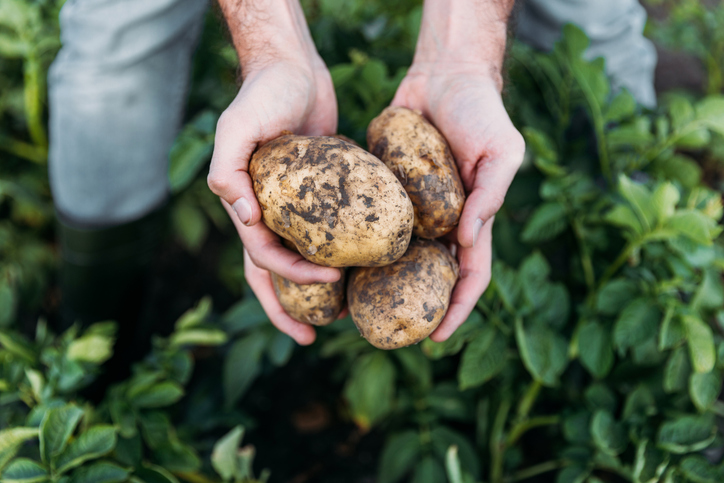
Check how much potatoes the whenua in your rohe could produce each year.
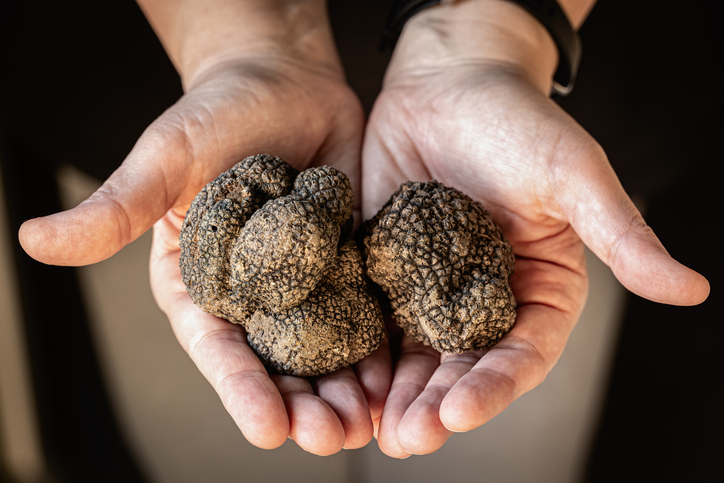
Compare how much truffles the whenua in your rohe could produce each year.