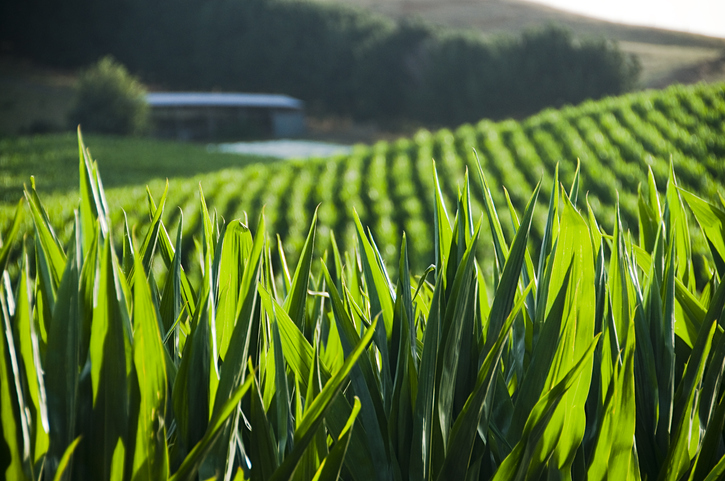
Maize - Job potential
Enterprise
Agribusiness
Arable crops
Employment
Productivity
Profitability
Explore how many jobs grain maize could support on the whenua in your rohe.

This dataset shows what dryland sheep and beef farming could earn across Aotearoa: revenue, expenses and operating profit in dollars per hectare per year, plus jobs, GDP and household income.
LWP Ltd fitted a national relationship between modelled pasture growth and farm revenue, using the Beef + Lamb New Zealand farm survey for 2019 to 2021. The other indicators follow from revenue. Regional multipliers from Stats NZ input-output tables add the flow-on GDP, income and jobs.
Pasture growth explains only about a third of the difference in revenue between farms, so real farms can earn a good deal more or less than the map shows. The numbers apply to dryland farms only.
Use the numbers to compare areas and land uses, not to budget a single farm.
Explore how many jobs grain maize could support on the whenua in your rohe.
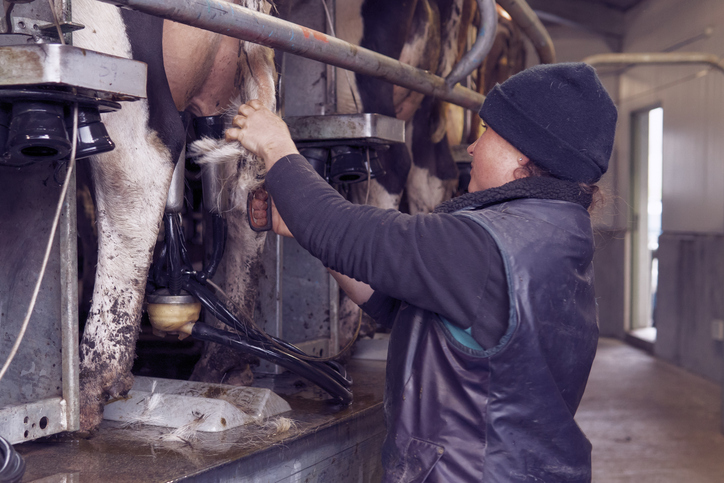
See what dairy farming earns, costs and pays in wages on land suited to it in your rohe.
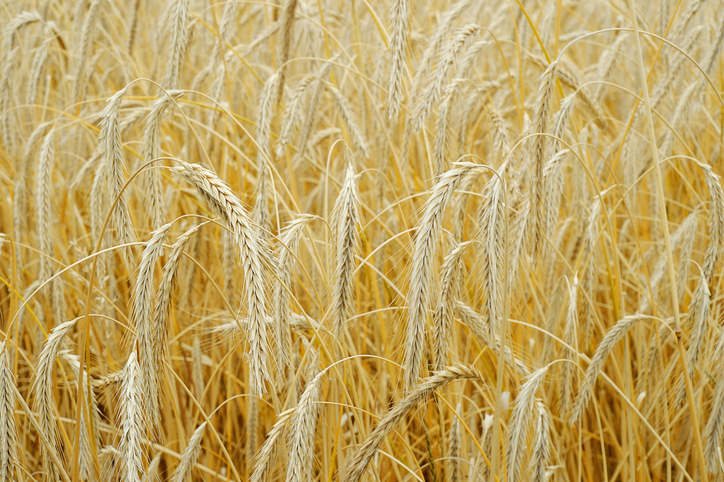
Find out how many jobs wheat could support on the whenua in your rohe.

Explore the operating profit wheat could earn on the whenua in your rohe each year.

Explore the operating profit cherries could earn on the whenua in your rohe each year.
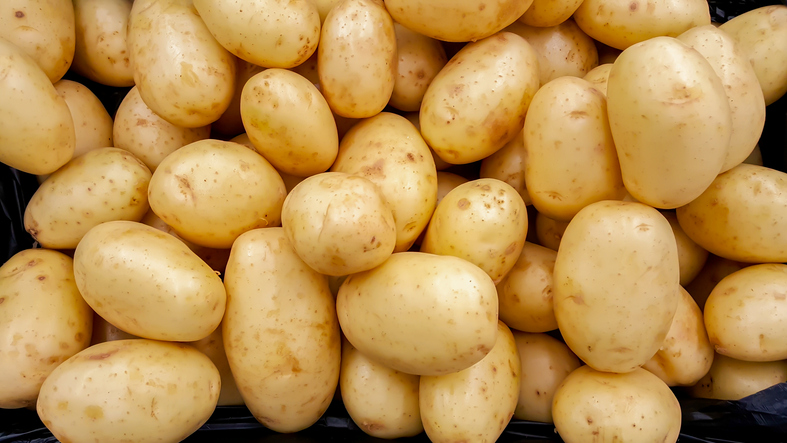
Learn how many jobs process potatoes could support on the whenua in your rohe.
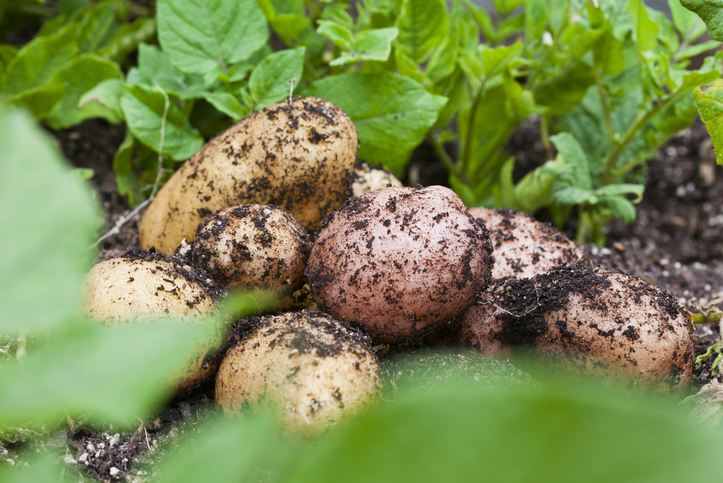
Discover the operating profit process potatoes could earn on the whenua in your rohe each year.
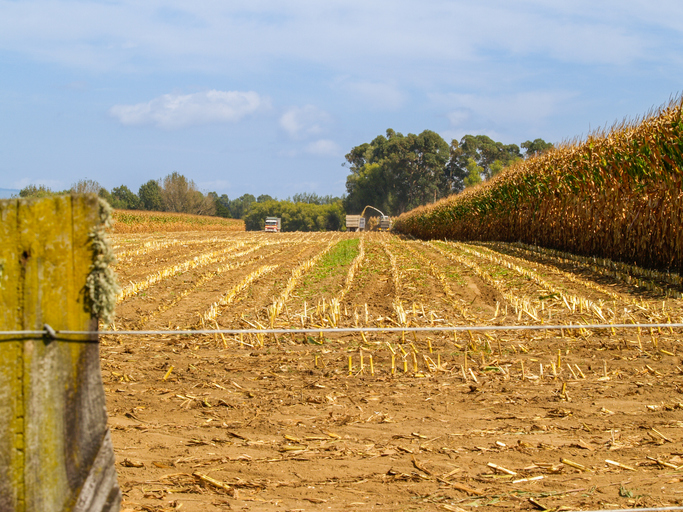
Learn the operating profit grain maize could earn on the whenua in your rohe each year.

See the operating profit vining peas could earn on the whenua in your rohe each year.
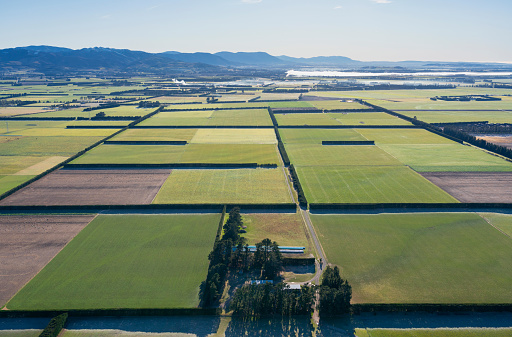
See how much pasture your land could grow under different irrigation choices.

Find out how pasture growth on your land could change as the climate warms.
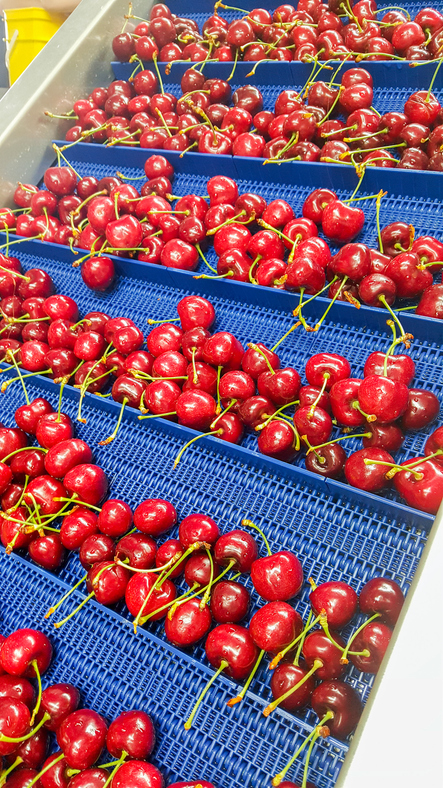
Find out how many jobs cherries could support on the whenua in your rohe.
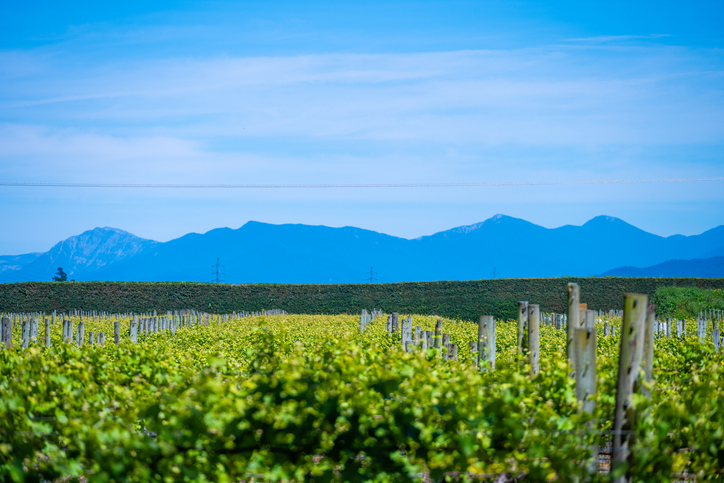
Discover how many jobs Sauvignon blanc grapes could support on the whenua in your rohe.
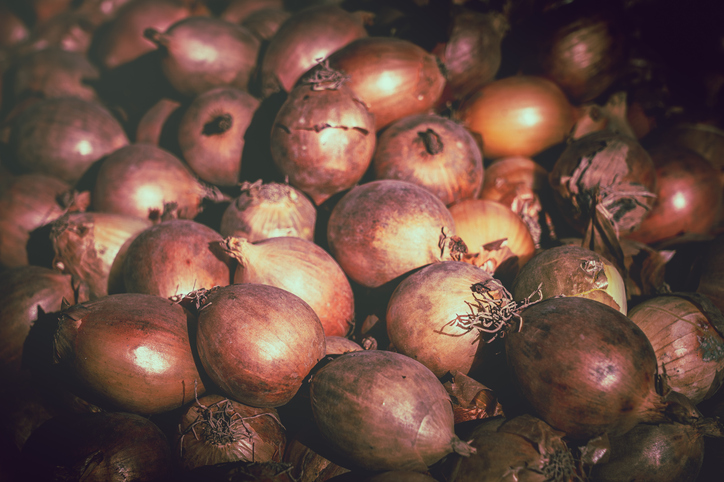
Find out the operating profit onions could earn on the whenua in your rohe each year.

Compare the operating profit green kiwifruit could earn on the whenua in your rohe each year.
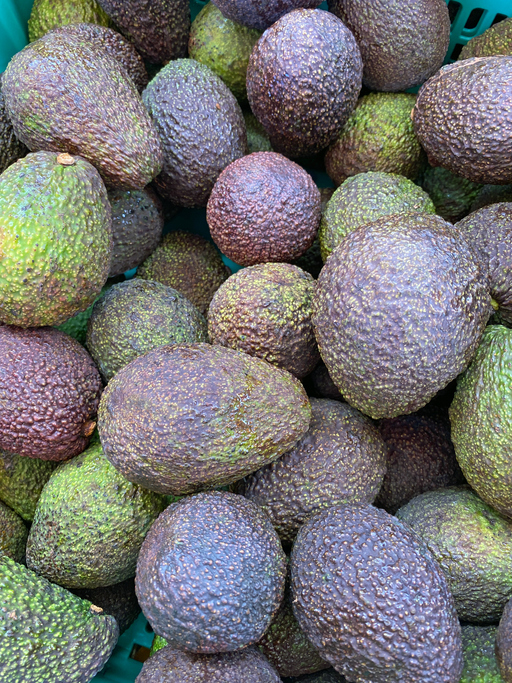
See the operating profit avocados could earn on the whenua in your rohe each year.
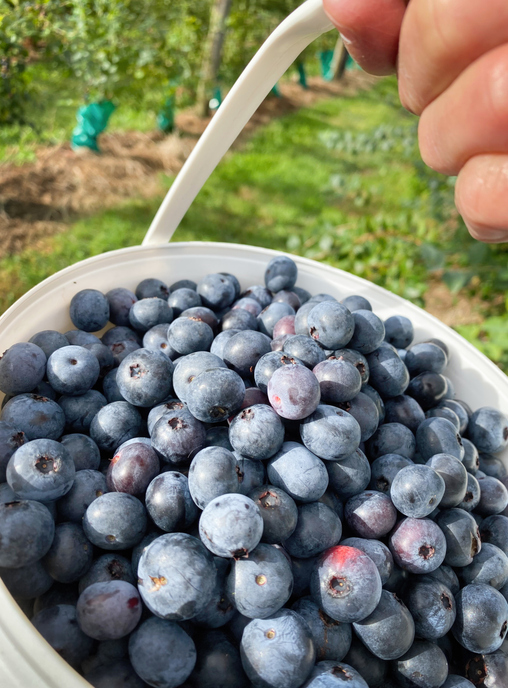
Learn how many jobs covered blueberries could support on the whenua in your rohe.
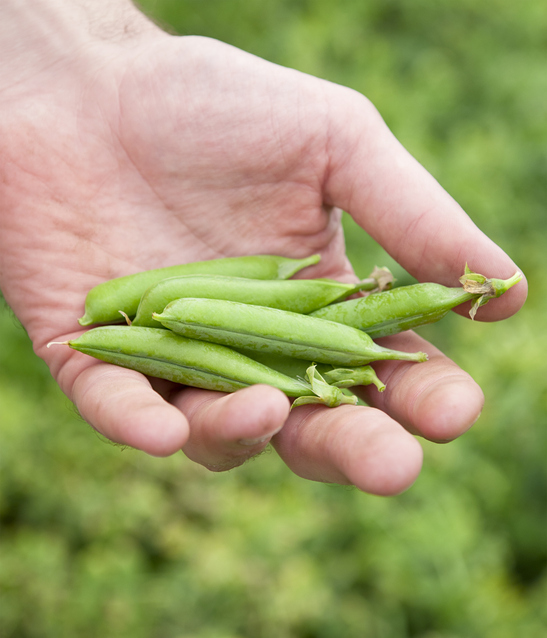
Compare how many jobs vining peas could support on the whenua in your rohe.
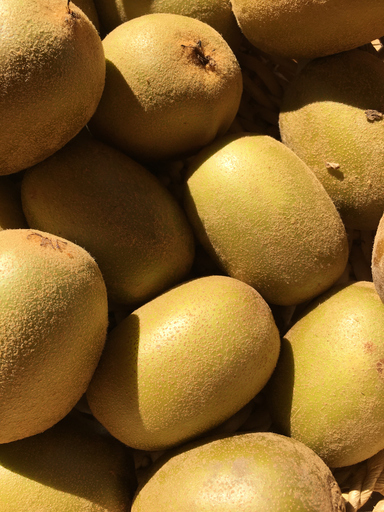
Check the operating profit gold kiwifruit could earn on the whenua in your rohe each year.
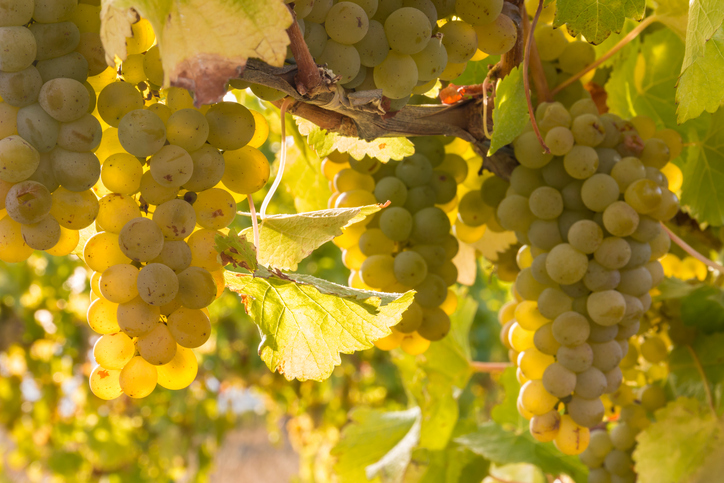
Compare the operating profit Sauvignon blanc grapes could earn on the whenua in your rohe each year.
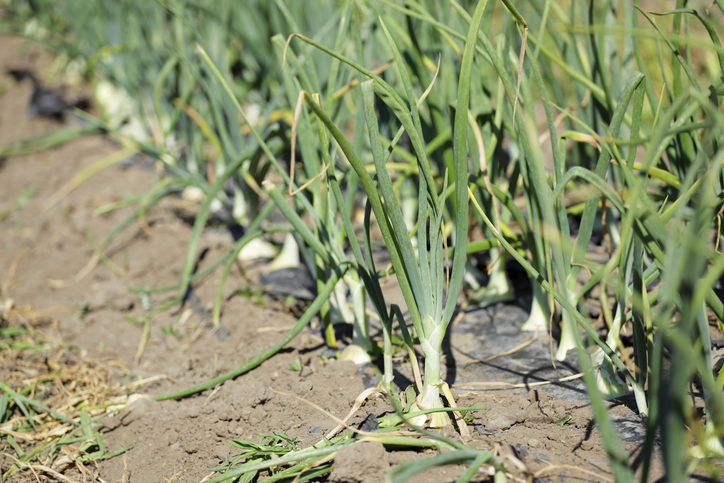
Check how many jobs onions could support on the whenua in your rohe.
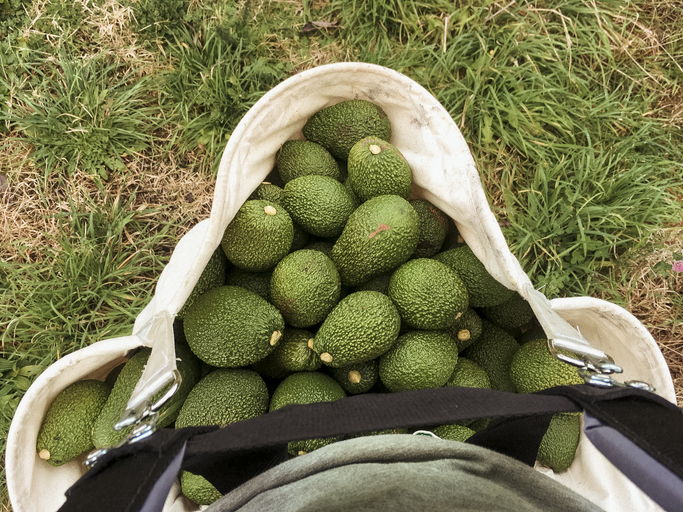
Compare how many jobs avocados could support on the whenua in your rohe.
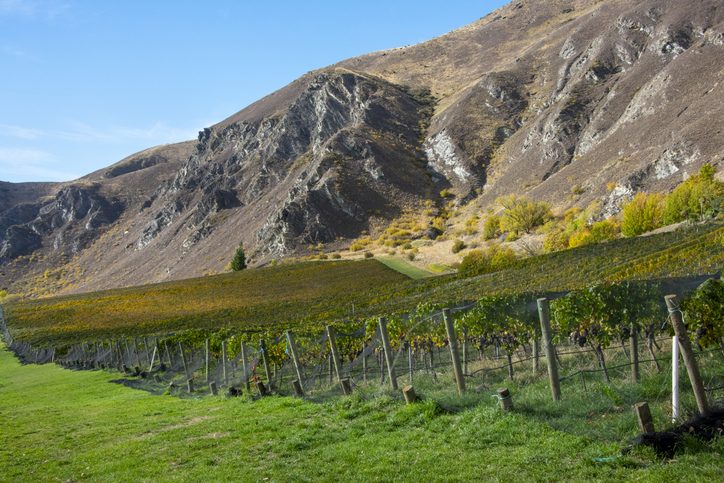
See how many jobs Pinot noir grapes could support on the whenua in your rohe.