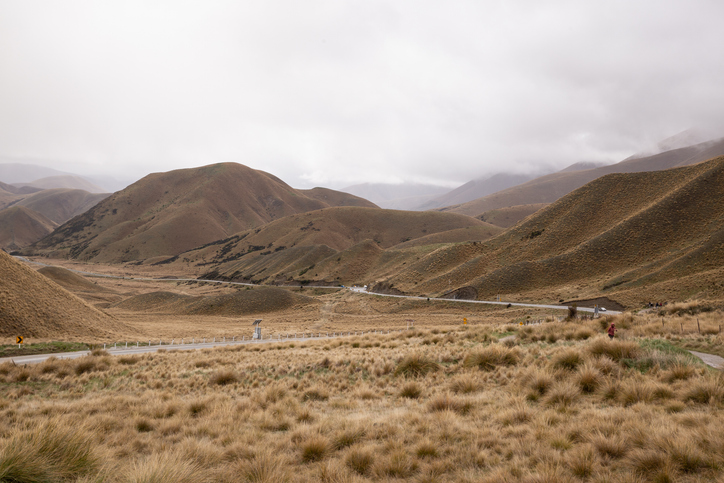
Pasture production maps under climate change
Climate
Adaptation
Productivity
Resilience
Sustainability
Find out how pasture growth on your land could change as the climate warms.
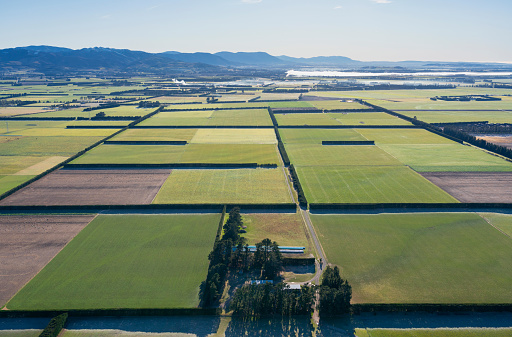
This dataset maps how much ryegrass and white clover pasture could grow each year across Aotearoa, under five combinations of irrigation and fertiliser, using past weather only.
The figure is the mean annual yield in kilograms of dry matter per hectare, so a higher number means more feed grown per hectare each year.
Plant & Food Research simulated the pasture with the APSIM crop model, assuming the pasture is grazed on a regular cycle and averaging results over 30 years of weather. It shows the general pattern of pasture growth across the country's conditions rather than a guaranteed yield for any one paddock.
Find out how pasture growth on your land could change as the climate warms.
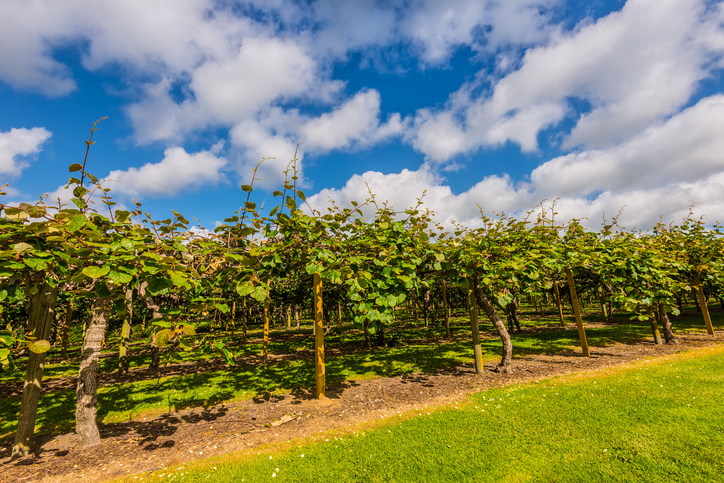
Find out how much kiwifruit the whenua in your rohe could produce each year.
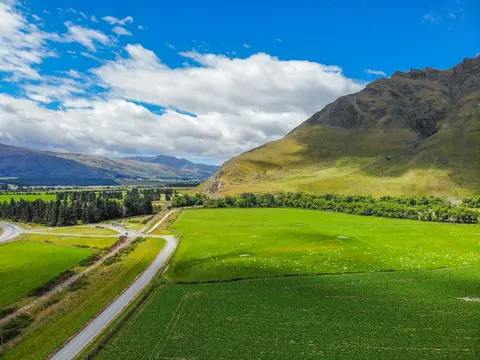
Discover which paddocks grow the most feed and why some fall short.
See how much nitrogen your crop rotation could leach into the ground.
Find out how much drier your pasture could get by 2050 as the climate changes.
See how susceptible your soil and climate are to nitrogen loss each month.
Find out how much grain maize the whenua in your rohe could produce each year.
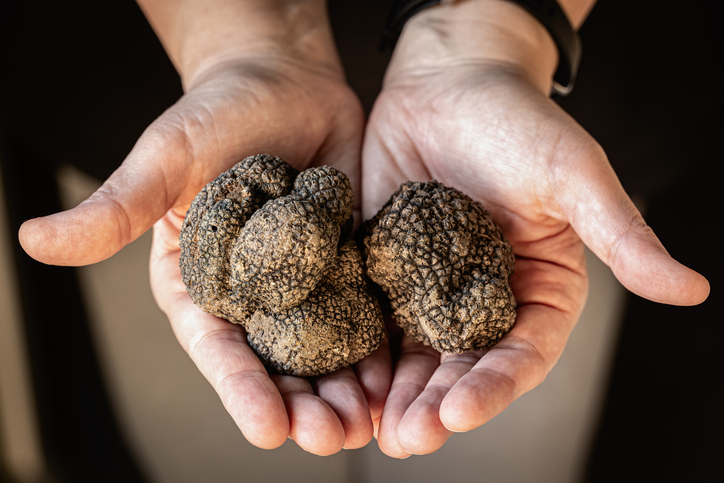
Compare how much truffles the whenua in your rohe could produce each year.
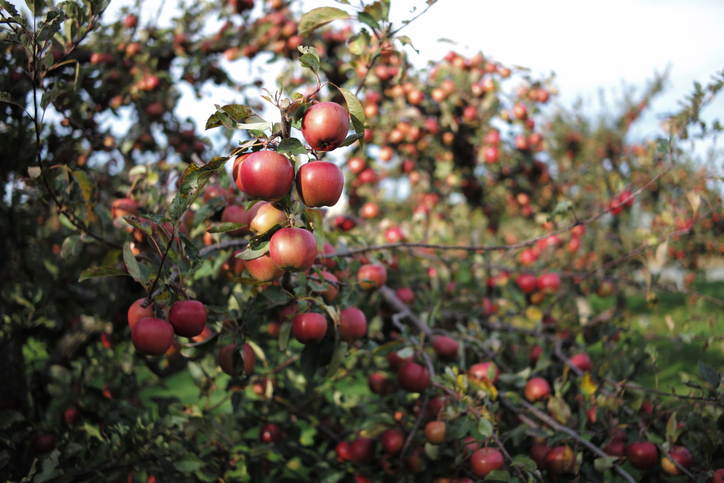
Learn how much apples the whenua in your rohe could produce each year.
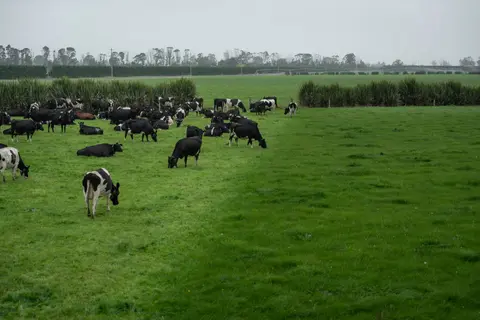
Review how fertiliser and grazing rotations are matched to feed demand.
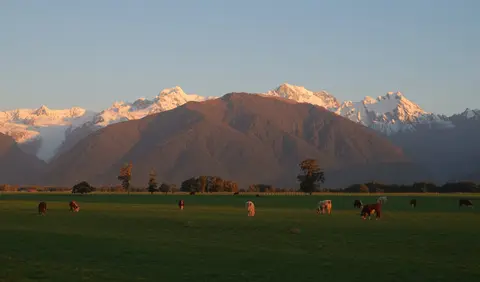
Discover ways to grow, manage and use pasture and crop for healthier, more efficient cows.
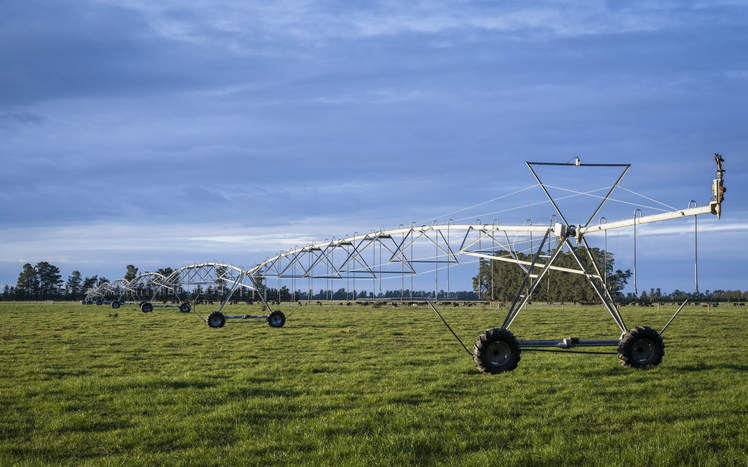
Learn how to assess and manage pasture for better dairy farm performance.
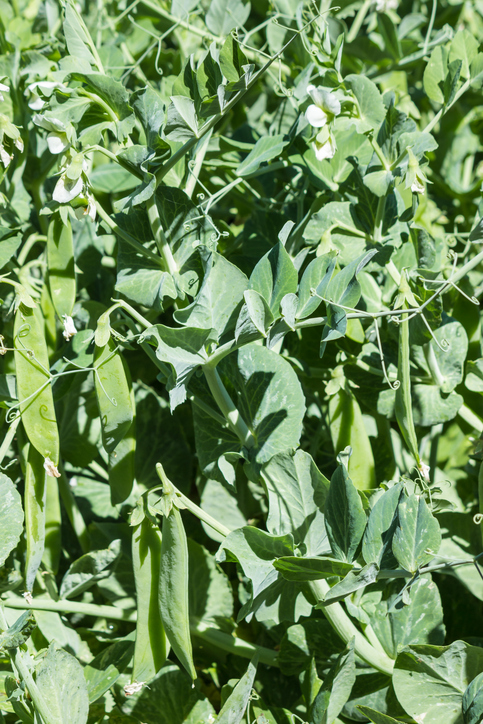
Learn how much peas the whenua in your rohe could produce each year.
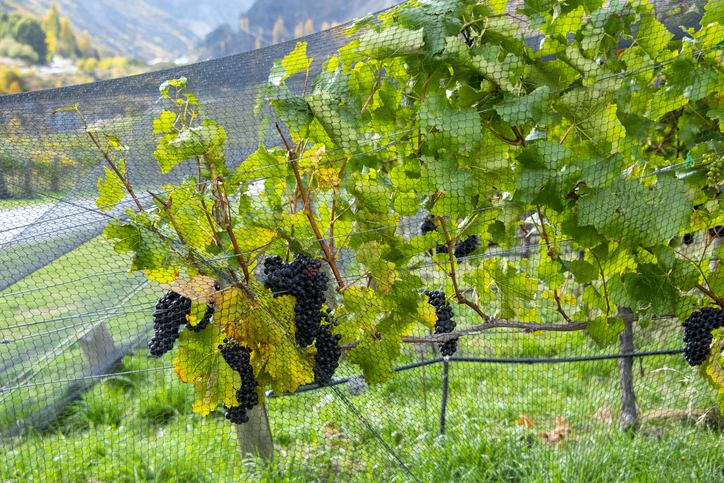
Discover how much Pinot noir grapes the whenua in your rohe could produce each year.
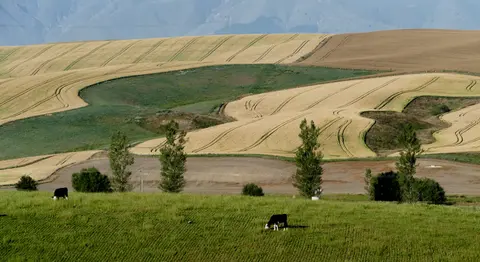
See how water shortfalls under maize could change as the climate warms.
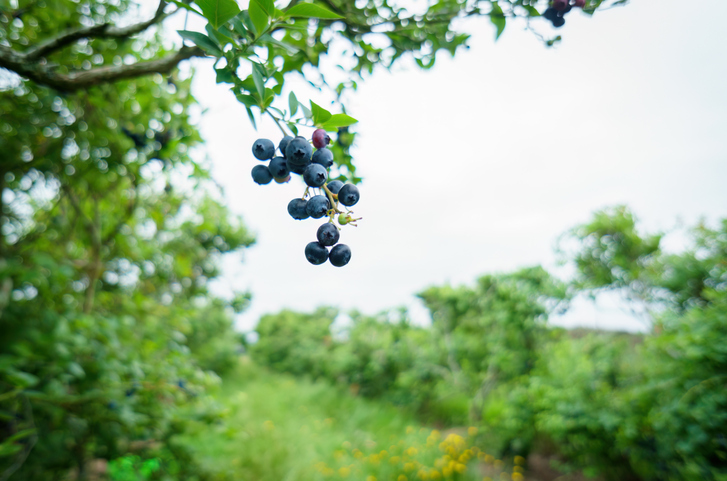
Discover how well blueberries could grow in your rohe by 2050 as the climate changes.
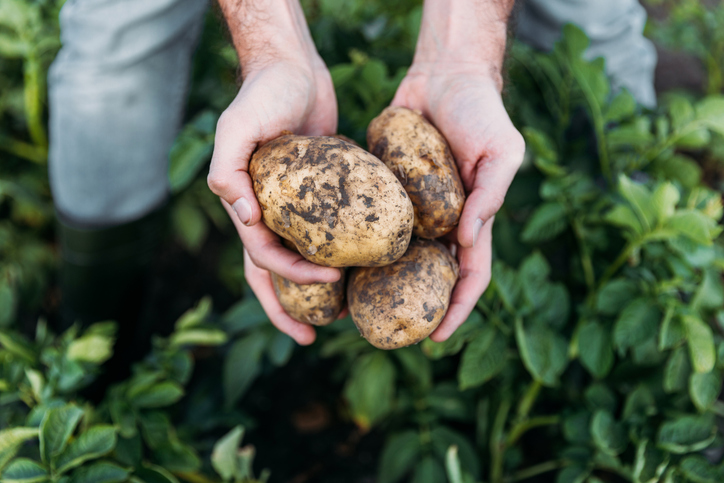
Check how much potatoes the whenua in your rohe could produce each year.
Discover how much mānuka honey the whenua in your rohe could produce each year.
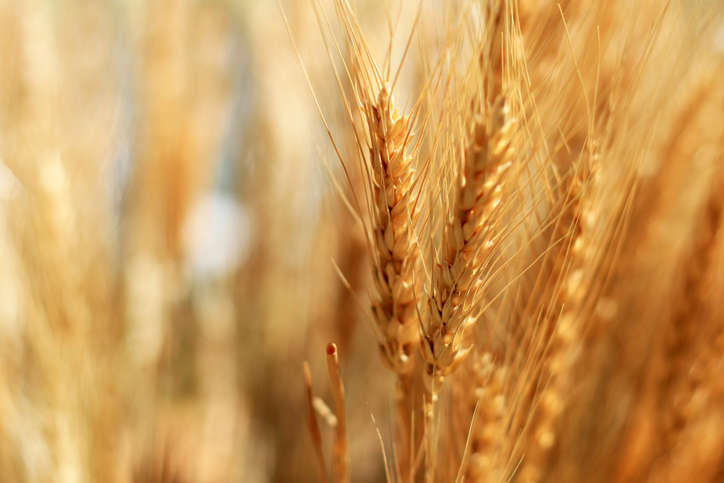
See how much wheat, barley and oats the whenua in your rohe could produce each year.
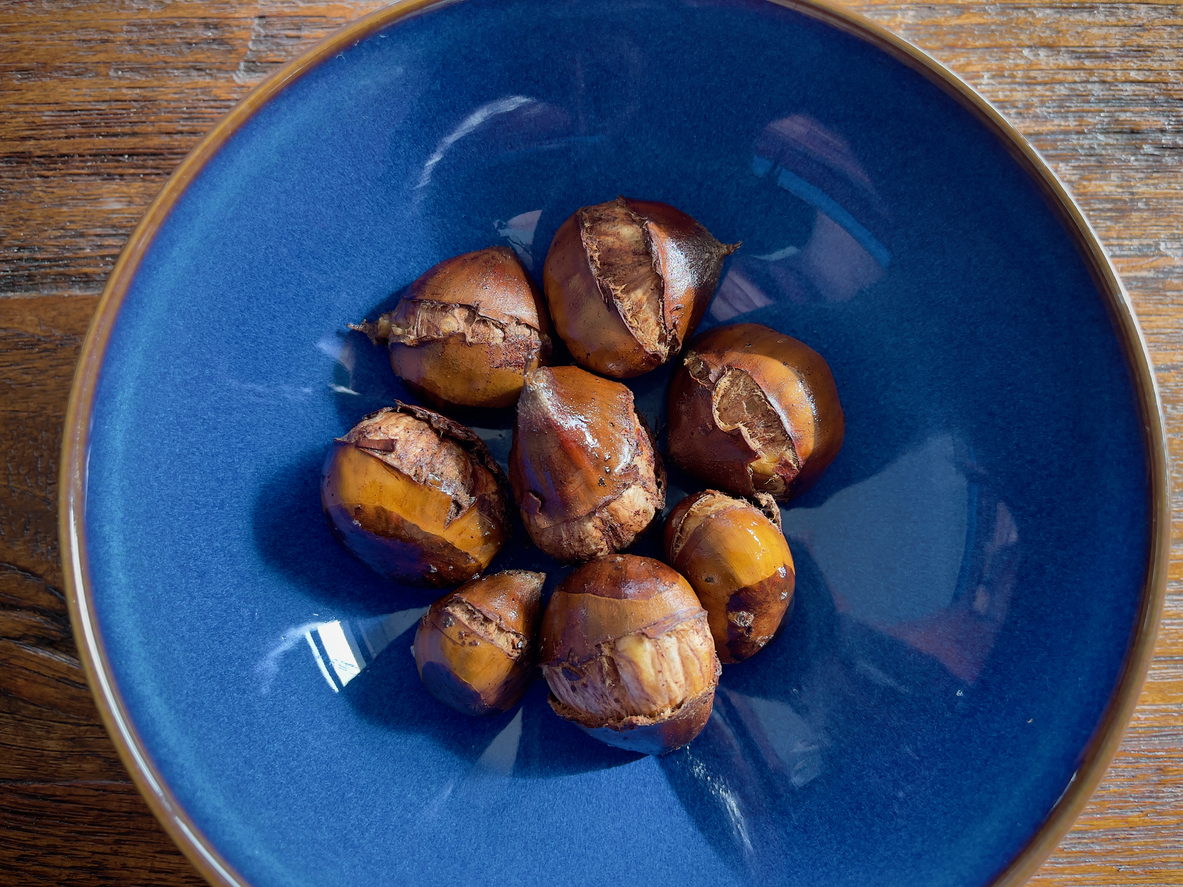
Learn how much chestnuts the whenua in your rohe could produce each year.
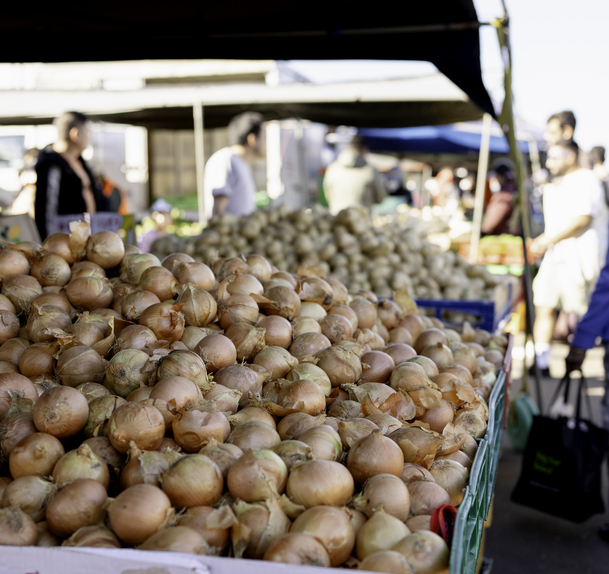
Explore how much onions the whenua in your rohe could produce each year.
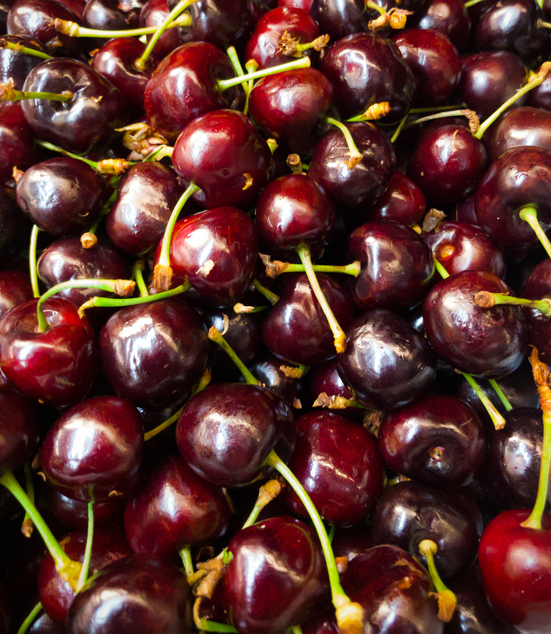
Explore how well cherries could grow in your rohe by 2050 as the climate changes.
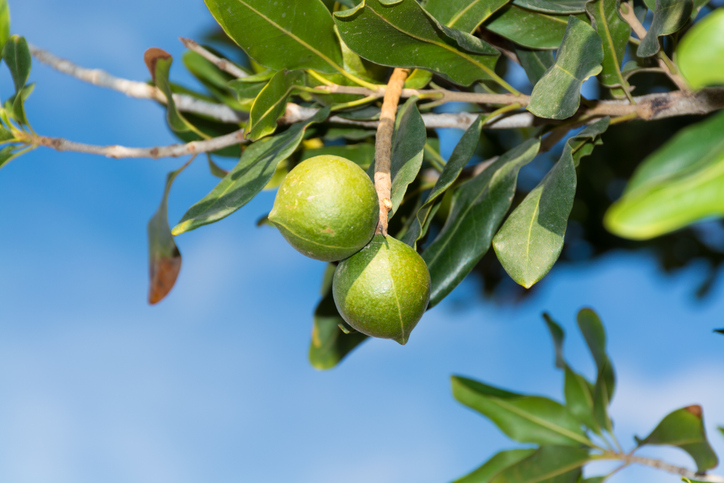
See how much macadamias the whenua in your rohe could produce each year.