
WWO biophysical susceptibility to N leaching and runoff
Whenua
Fertiliser
Risk
Water
See how susceptible your soil and climate are to nitrogen loss each month.
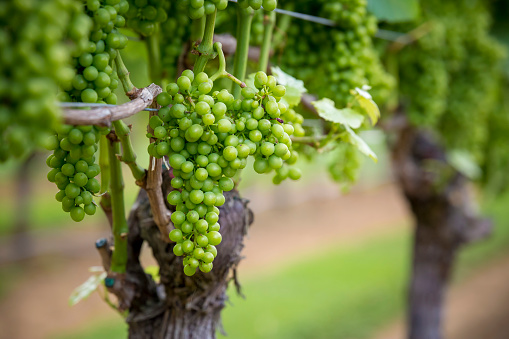
This dataset maps how much nitrogen could leach from three common crop rotations across Aotearoa, ryegrass and maize, broadacre vegetables, and intensive vegetables, under six combinations of irrigation and fertiliser.
The figure is the mean annual nitrogen leached below the root zone, in kilograms of nitrogen per hectare, averaged over 30 years of past weather; a higher number means more nitrogen is likely reaching groundwater.
Plant & Food Research, Manaaki Whenua and NIWA simulated the rotations with the APSIM model, using past climate data and S-map soils. The results assume tidy, well-timed management and no pest or disease losses, and are less certain in areas with unusual climates, such as Northland or Central Otago.
See how susceptible your soil and climate are to nitrogen loss each month.
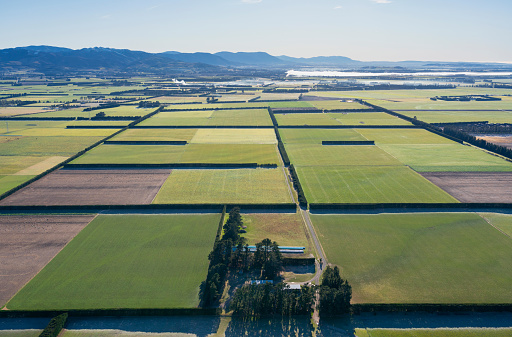
See how much pasture your land could grow under different irrigation choices.
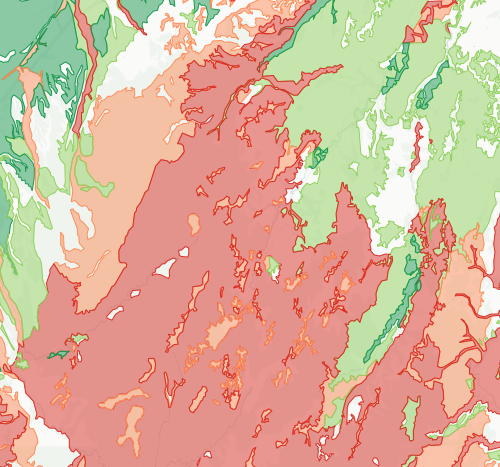
Check how likely nitrogen is to leach through your soil
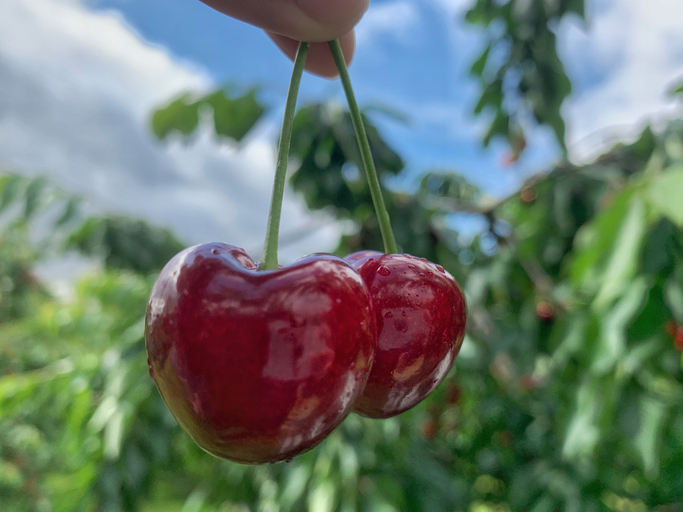
See how much cherries the whenua in your rohe could produce each year.
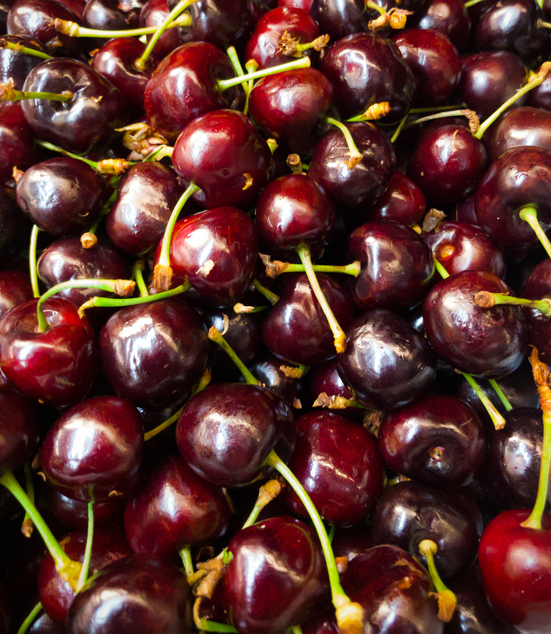
Explore how well cherries could grow in your rohe by 2050 as the climate changes.
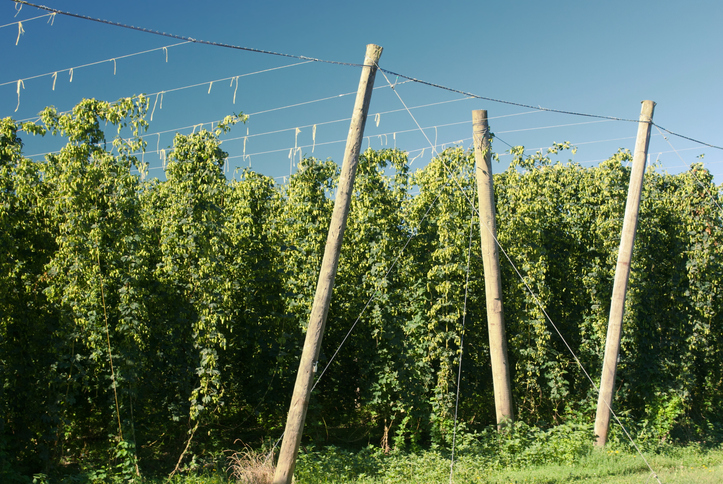
Compare how much hops the whenua in your rohe could produce each year.
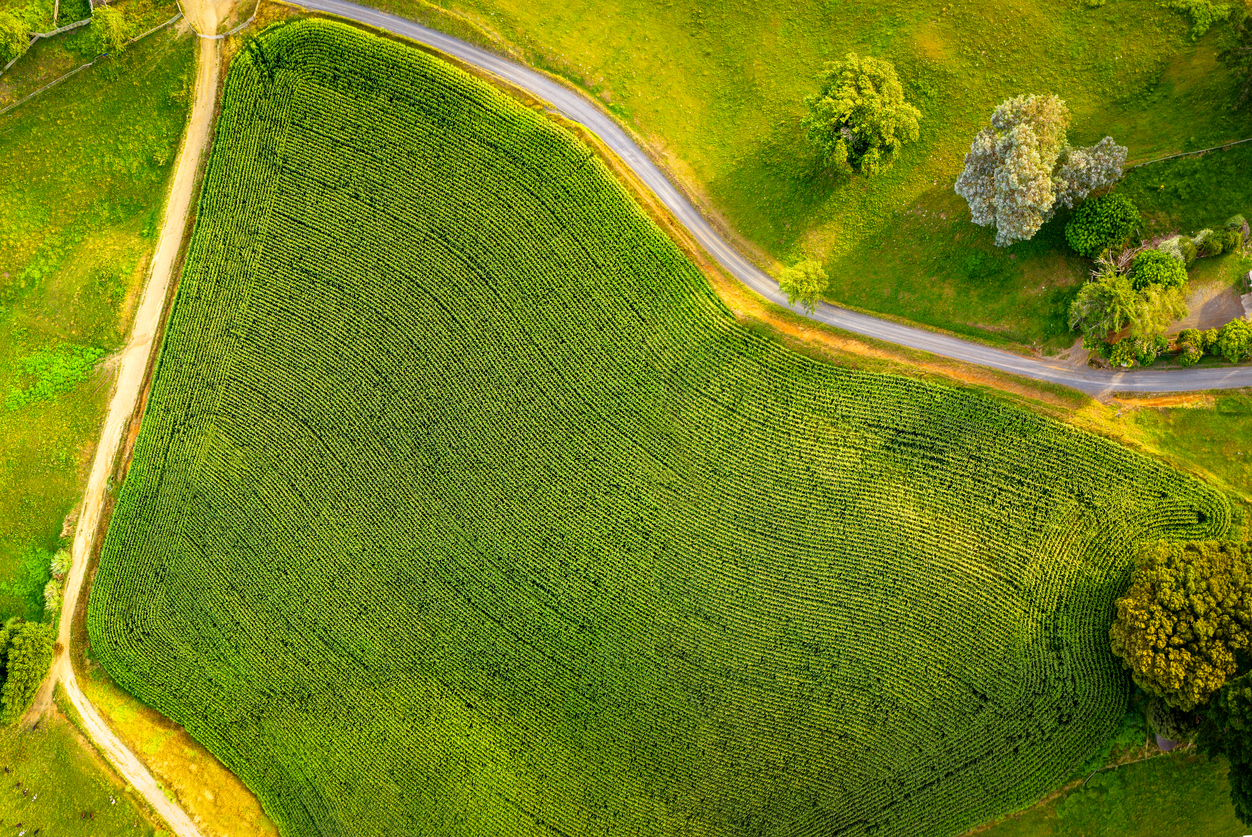
Find out how much grain maize the whenua in your rohe could produce each year.
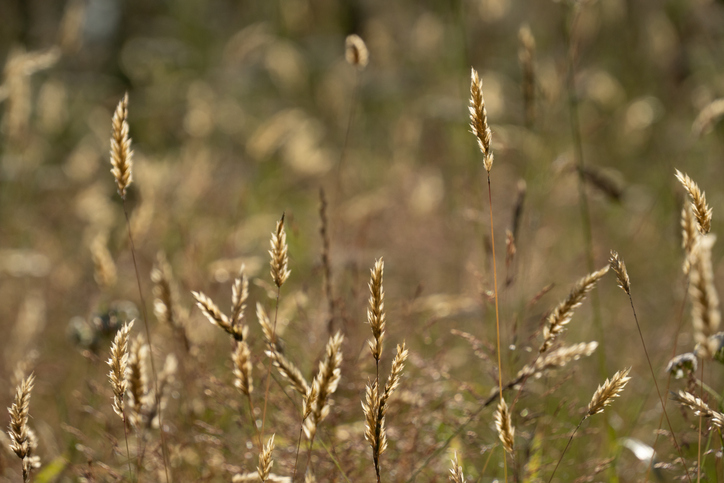
This guide explains how to cut nitrogen use, reducing nitrous oxide emissions on farms.
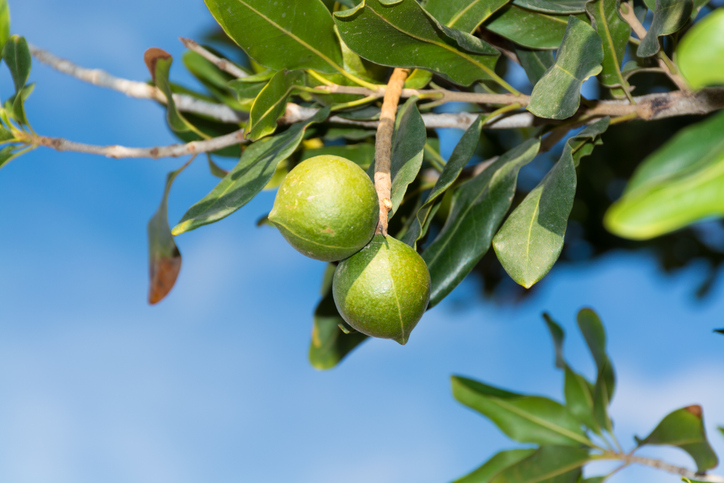
See how much macadamias the whenua in your rohe could produce each year.
Explore how many jobs grain maize could support on the whenua in your rohe.
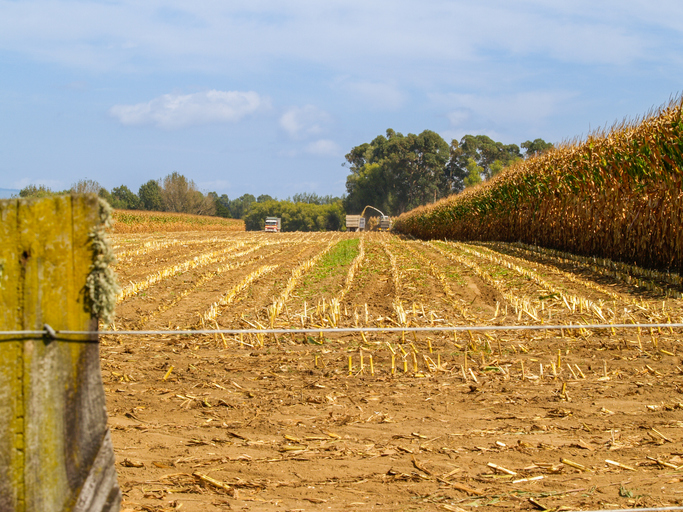
Learn the operating profit grain maize could earn on the whenua in your rohe each year.
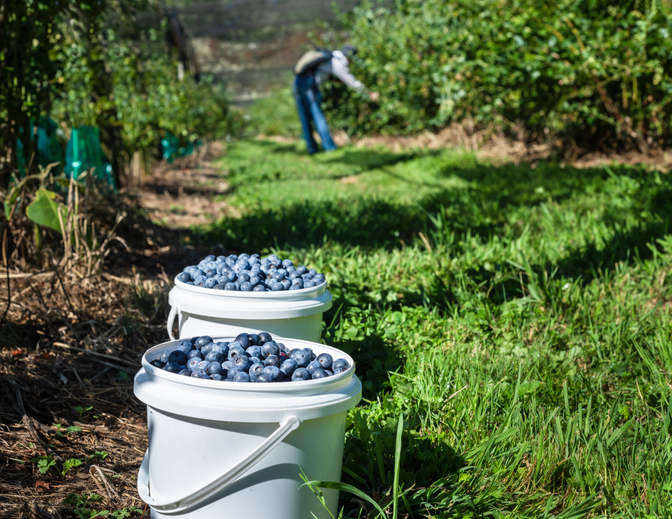
Compare how much blueberries the whenua in your rohe could produce each year.

Discover how much mānuka honey the whenua in your rohe could produce each year.
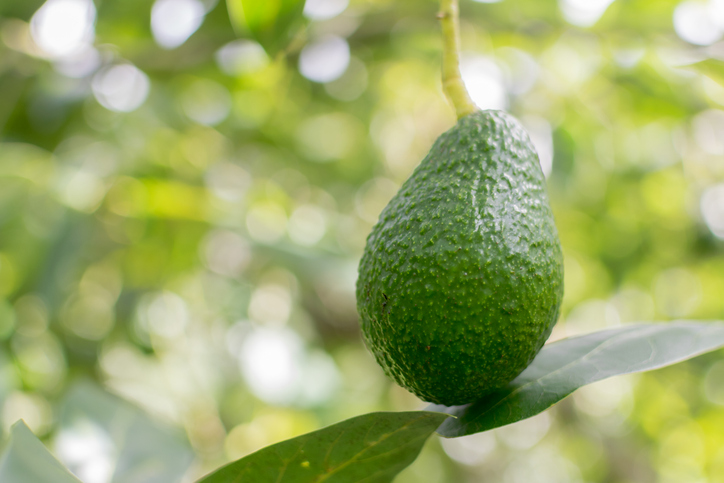
Check how much avocados the whenua in your rohe could produce each year.
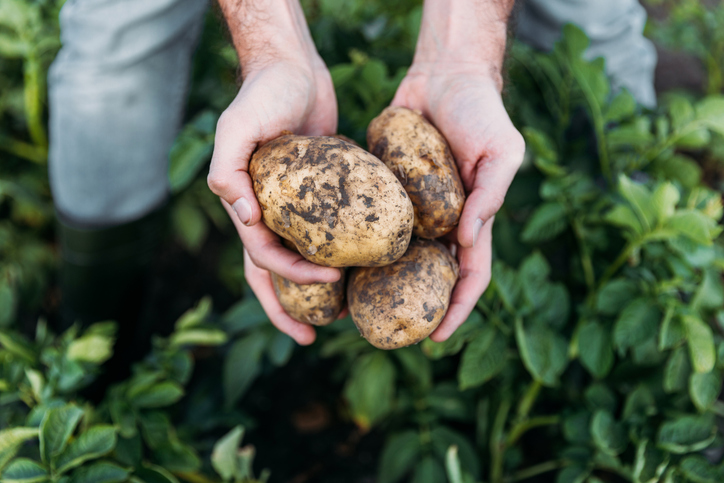
Check how much potatoes the whenua in your rohe could produce each year.
Track how sowing and harvest timing for maize could shift as the climate changes.
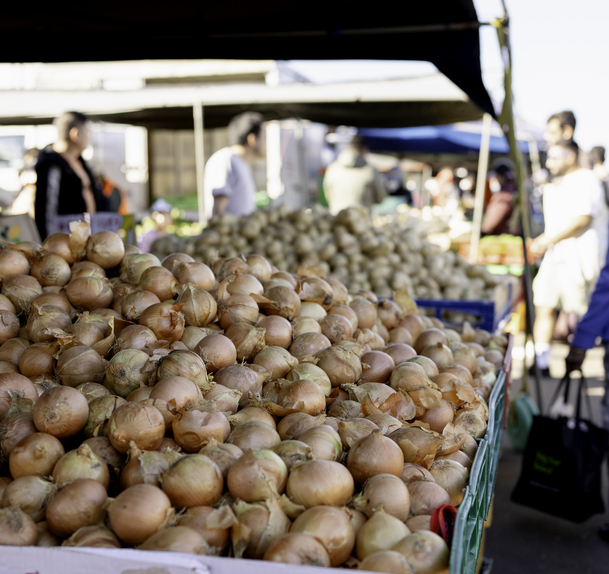
Explore how much onions the whenua in your rohe could produce each year.
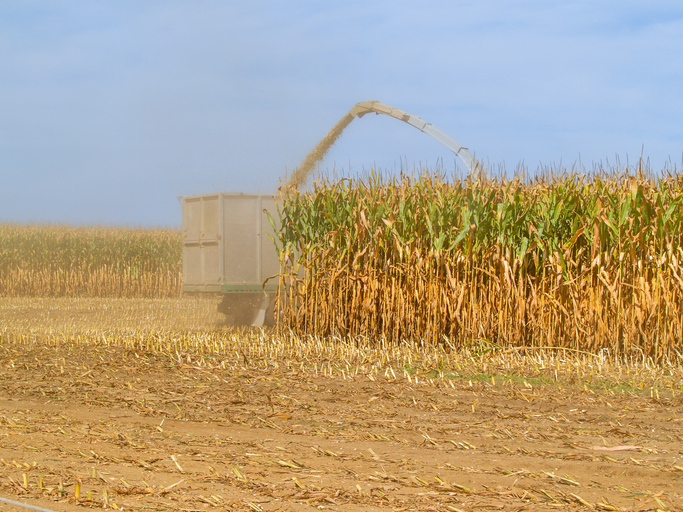
Find out how often heat stress could hit maize in your rohe as the climate changes.
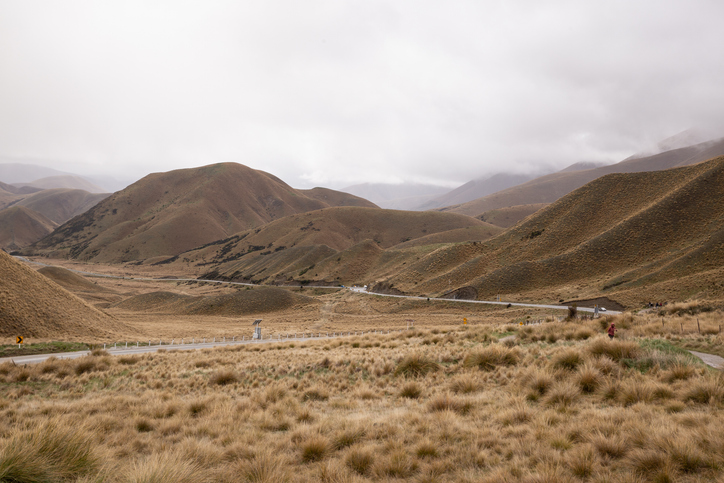
Find out how pasture growth on your land could change as the climate warms.
Review how fertiliser and grazing rotations are matched to feed demand.
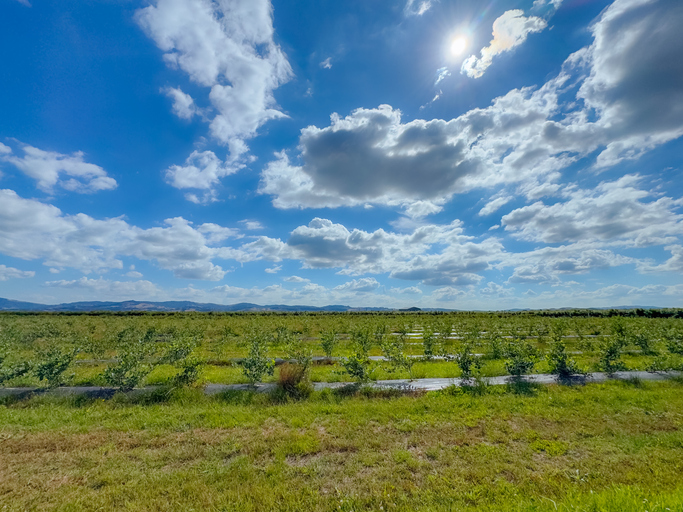
Compare suitability and yield potential across a wide range of crops.
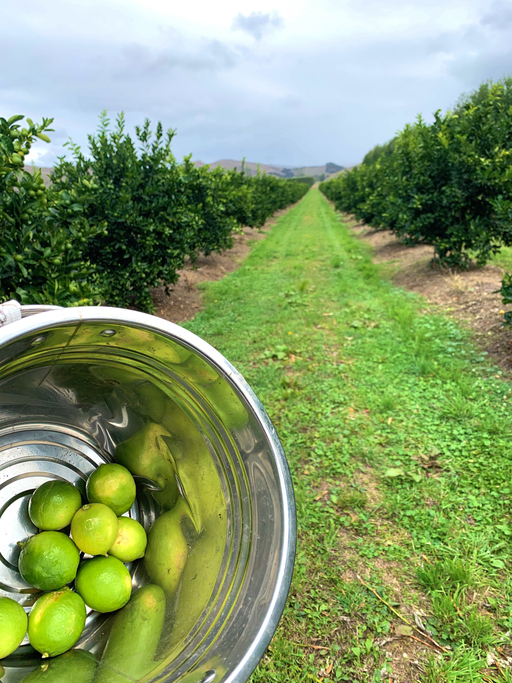
Check how much citrus the whenua in your rohe could produce each year.
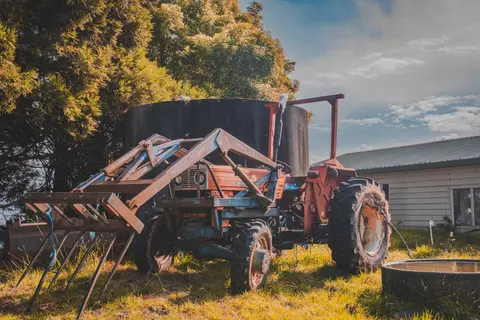
Explore how Owl Farm has lowered nitrogen fertiliser use and modelled nitrogen loss.