Dairy - Economic indicators
Enterprise
Dairy
Employment
Productivity
Profitability
See what dairy farming earns, costs and pays in wages on land suited to it in your rohe.
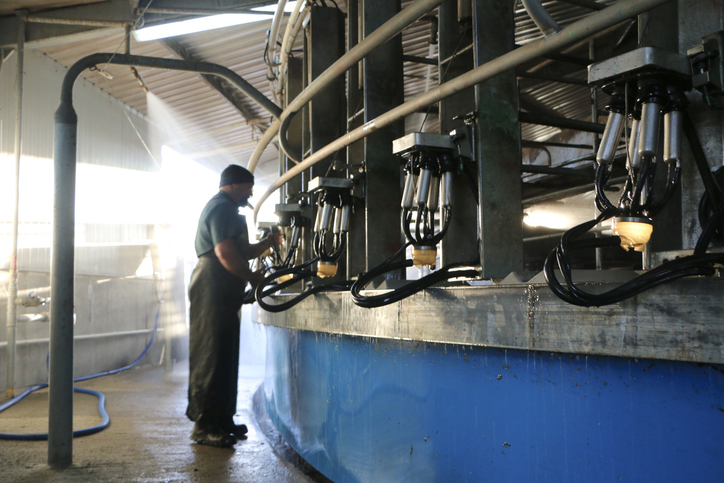
New Zealand Dairy Statistics provides insights into the national dairy herd, tracking productivity, size, and regional trends over time. It helps understand herd distribution, which can be vital for calculating emissions.
Note that some of the underlying data is self-reported by producers, so take care if you intend to rely on it for decision-making.
See what dairy farming earns, costs and pays in wages on land suited to it in your rohe.
A comprehensive dataset of Aotearoa farm financial, production, and environmental data for research use.
Find out about a no-cost method to reduce your dairy farm's greenhouse gas emissions.
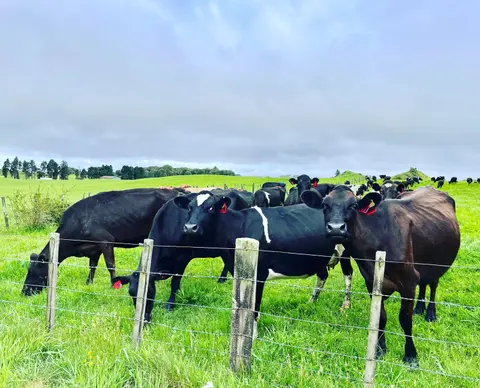
Check out ways to manage herd health, breeding and biosecurity to lift farm performance.
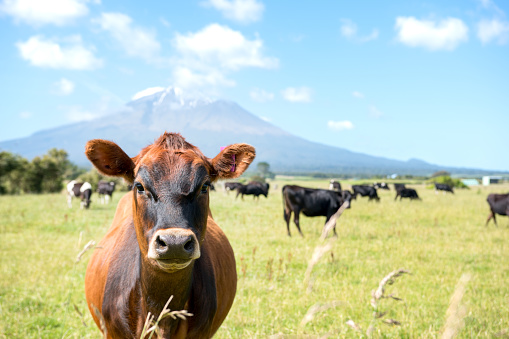
Explore New Zealand's livestock trends with interactive graphs and visualisations.
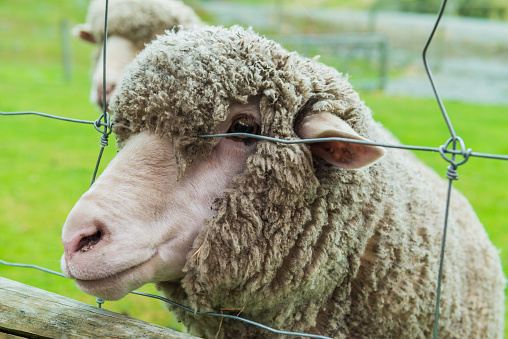
A report on New Zealand's livestock methane emissions and their impacts.
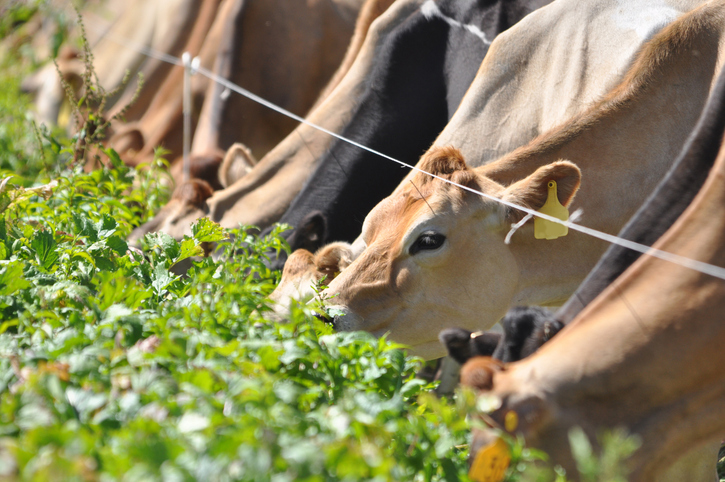
Find templates and calculators to help manage feed supply and demand on your dairy farm.
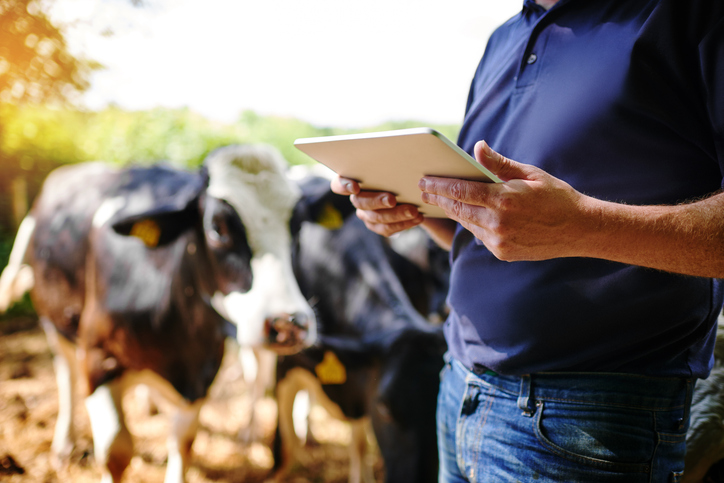
EconTracker provides key economic data for Aotearoa dairy farmers and industry professionals.
Farm 4 Life offers 24/7 online videos to enhance dairy farming skills and decision-making.
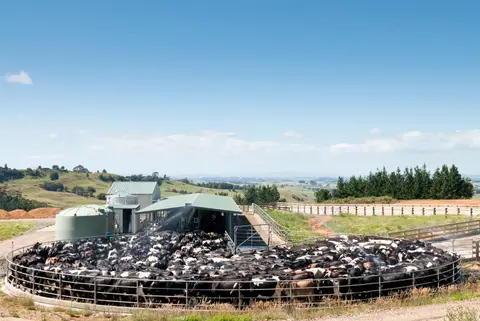
See data and advice on balancing dairy profits with lower greenhouse gas emissions.
Understand how to protect cows from heat, cold and adverse weather to limit stress and losses.
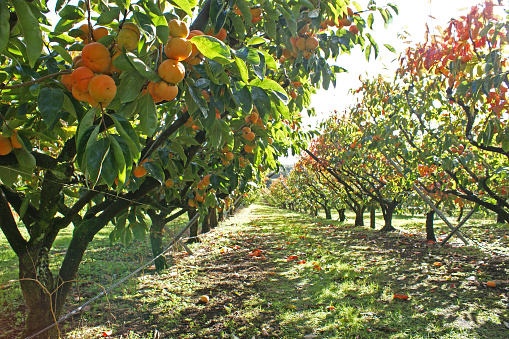
This report explains how to estimate the economics of land uses like horticulture and dairy.
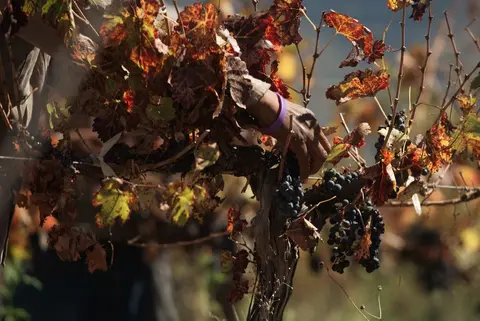
Compare planted and producing vineyard hectares by region and grape variety, year by year.
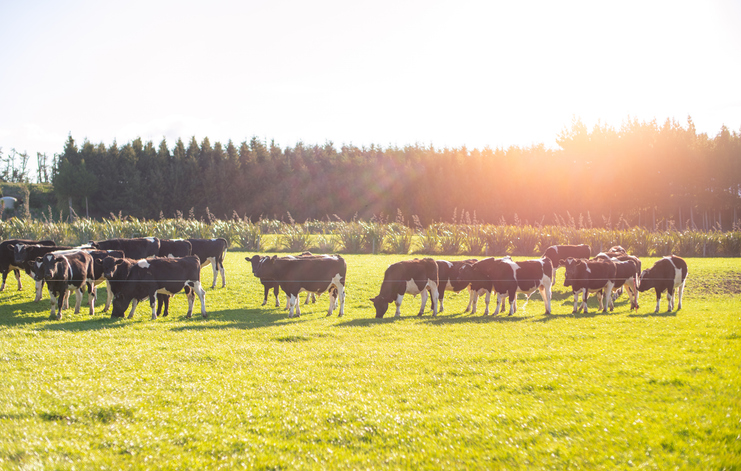
Learn about different on-farm solutions for reducing greenhouse gas emissions from dairy farms.
The FeedChecker calculator helps you optimise feed for cows by comparing nutrient needs and diet.
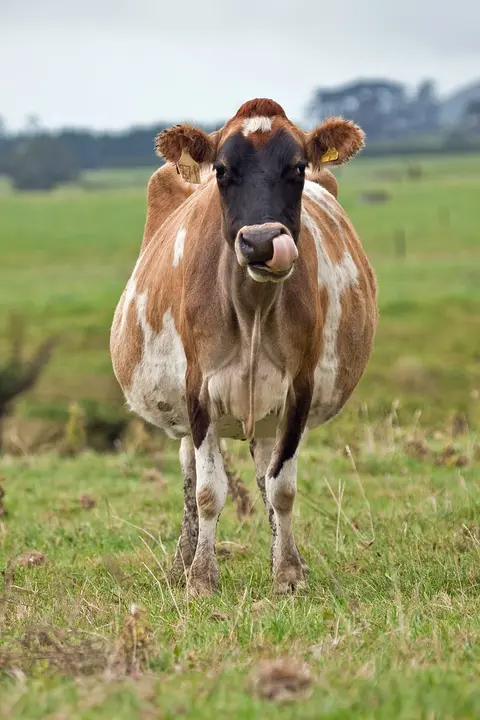
Track how a Waikato demonstration farm lifts its 6-week in-calf rate each season.
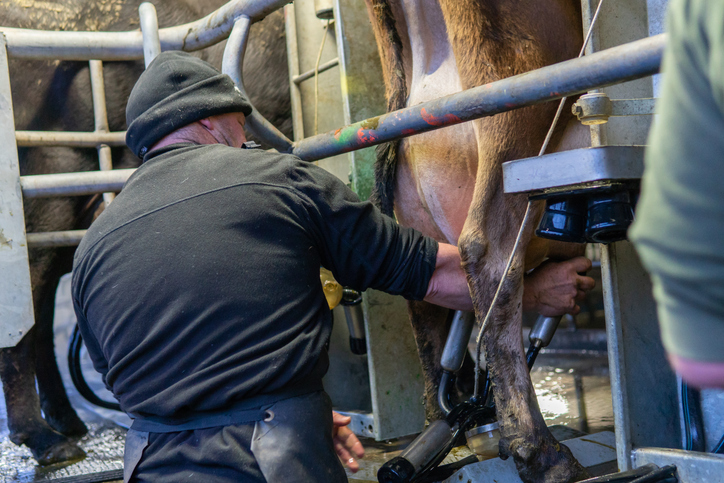
Evaluate switching to once-a-day (OAD) milking with this decision matrix tool.
A tool for farmers to track and report on farm GHG emissions and sequestration.
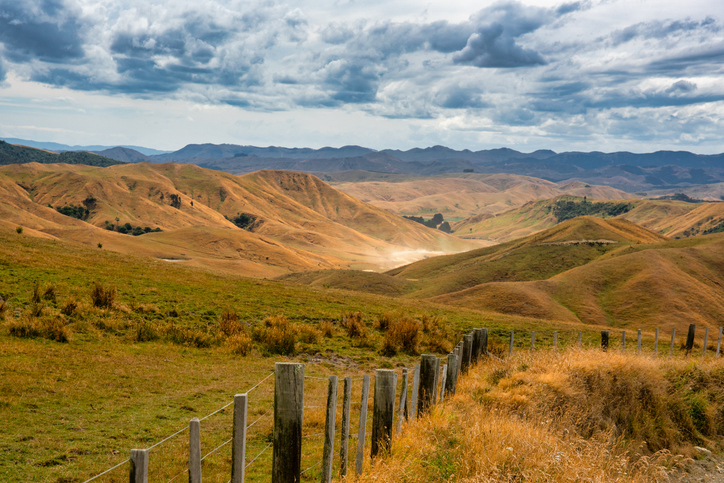
Research about how livestock farms in Aotearoa manage droughts.
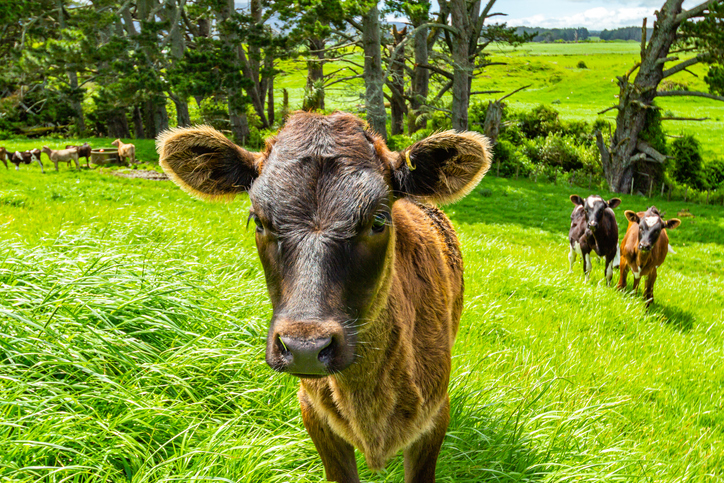
Compare nitrogen, phosphorus and greenhouse gas losses across dairy farm types.
FarmStrong offers health check tips for farmers to monitor their well-being.
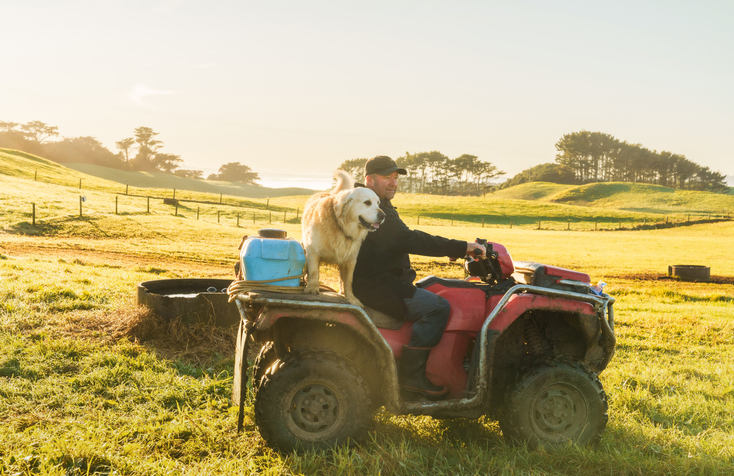
The DairyNZ Econ Tracker summarises key economic data for New Zealand dairy farmers.
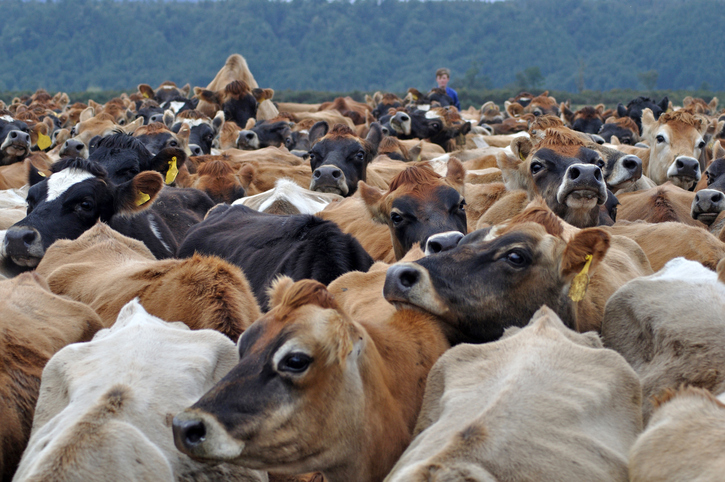
Learn how dairy farmers in New Zealand can reduce greenhouse gas emissions effectively.