Drought indicator charts
Climate
Risk
Water
View drought intensity data and charts for your region. Updated monthly.
The Soil Moisture Deficit (SMD) map shows current and historical soil moisture levels across New Zealand. Monitoring SMD can help you plan your irrigation and manage your crops more effectively through drought times.
View drought intensity data and charts for your region. Updated monthly.
View maps showing average soil moisture deficit onset and termination dates across New Zealand.
The NIWA Drought Forecasting Dashboard helps farmers track drought risk and rainfall for the next 35 days for better planning and decision-making.
Learn how soil carbon impacts climate change and things you can do on your farm to offset your emissions.
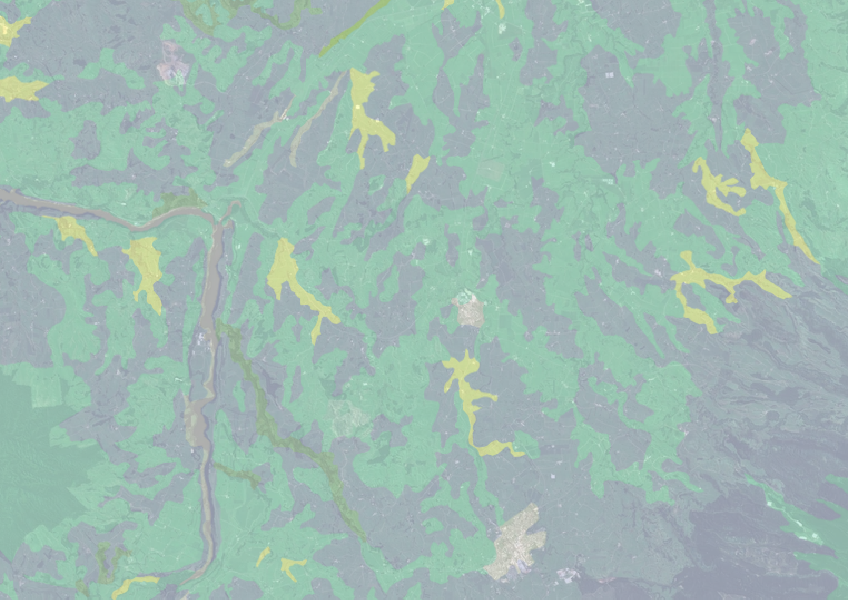
Find how deep you go before soil drainage slows across New Zealand.
See how drought conditions and extreme rainfall in Aotearoa have changed as a result of climate change.
See how recent rainfall in your rohe compares to historic records - a useful indicator for drought planning.
Explore drought impacts and find adaptation strategies for a changing climate.
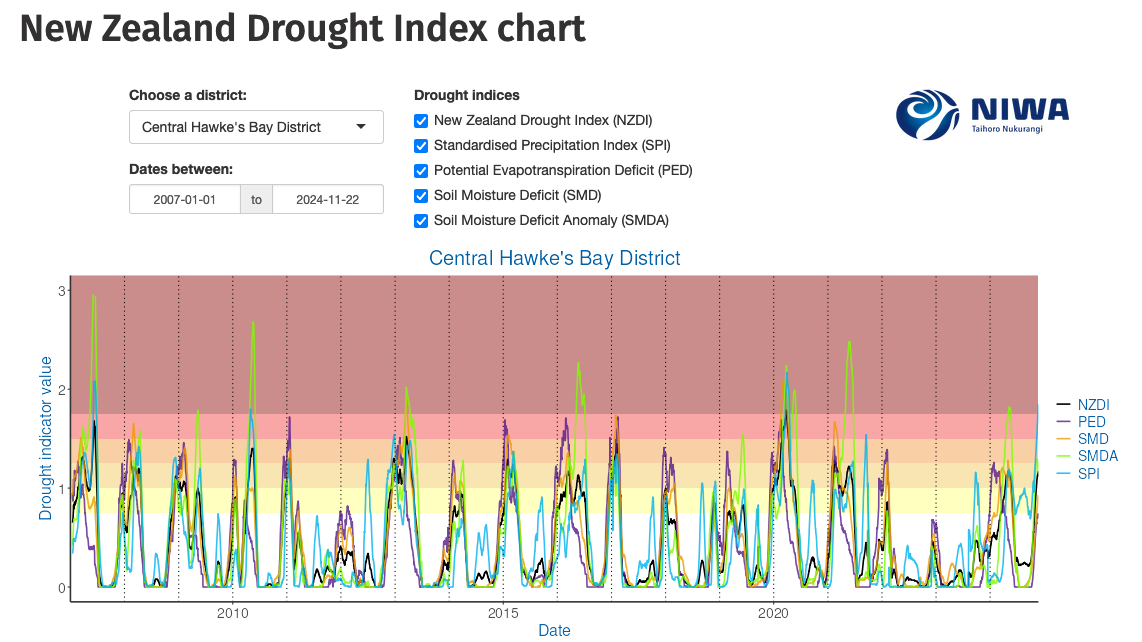
Monitor drought in New Zealand using key indicators and climate data. Access maps and downloads.
This guide explains effective forage cropping management for livestock.
Tips for ensuring your Māori land trust is performing.
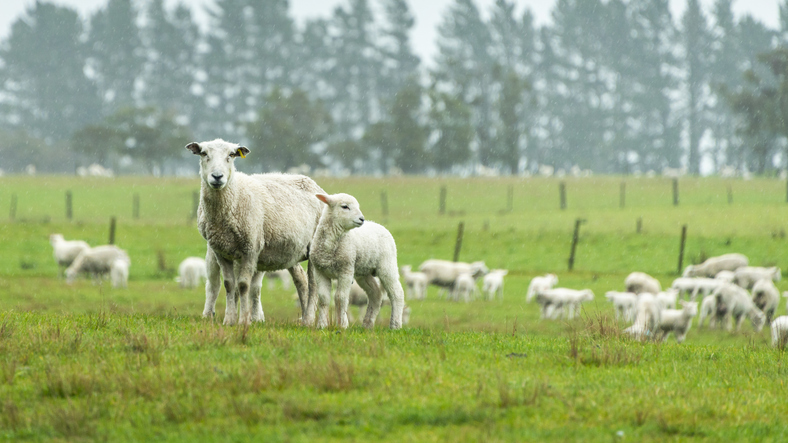
The SPI measures drought and wet conditions using recent rainfall data.
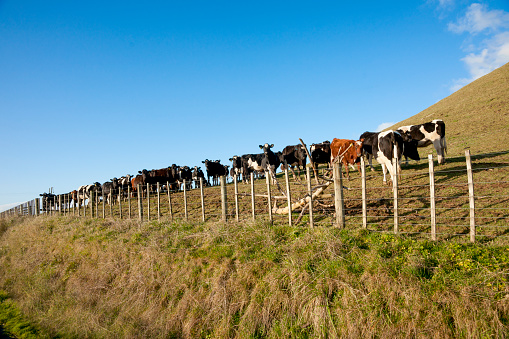
This research analyses future drought risks due to climate change impacts.
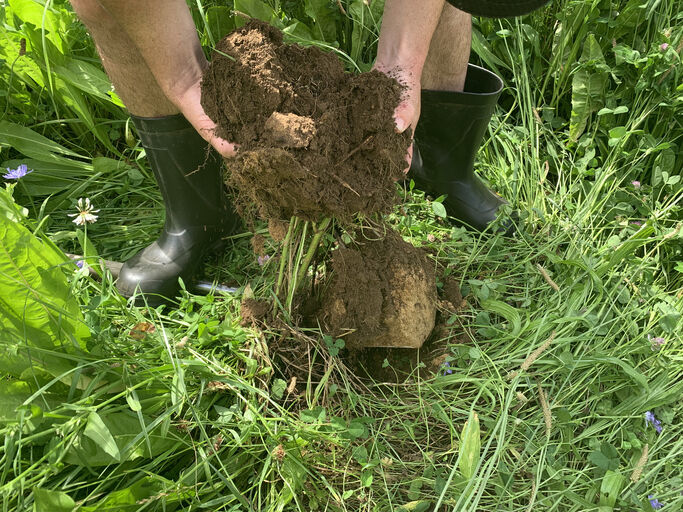
Learn how soil forms, its role on the diverse landscapes of Aotearoa, and its impacts on land management.
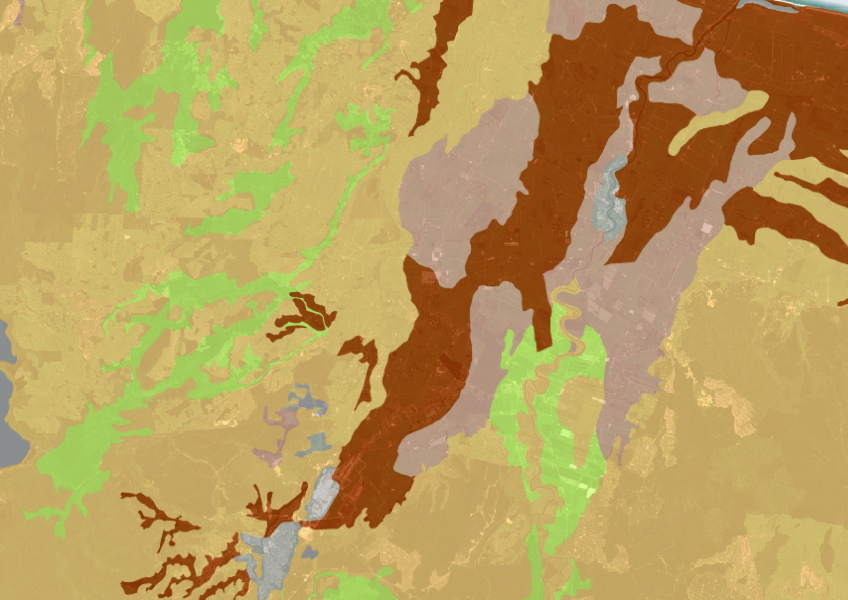
A dataset that estimates soil temperature across the motu.
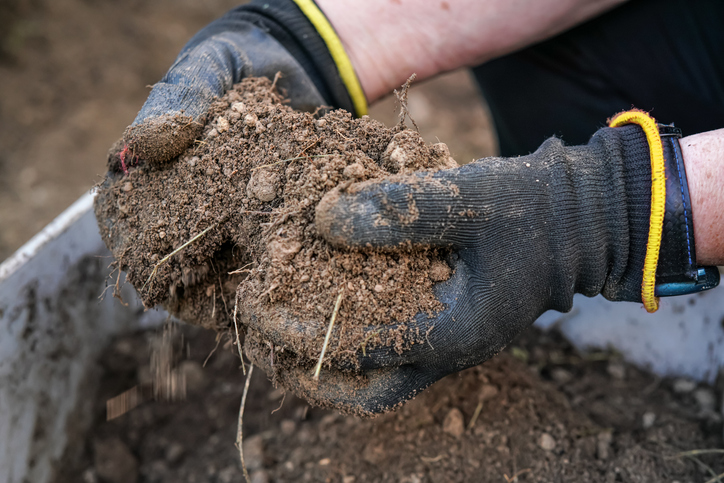
Learn about soil's role in farming and improve soil management for better production.
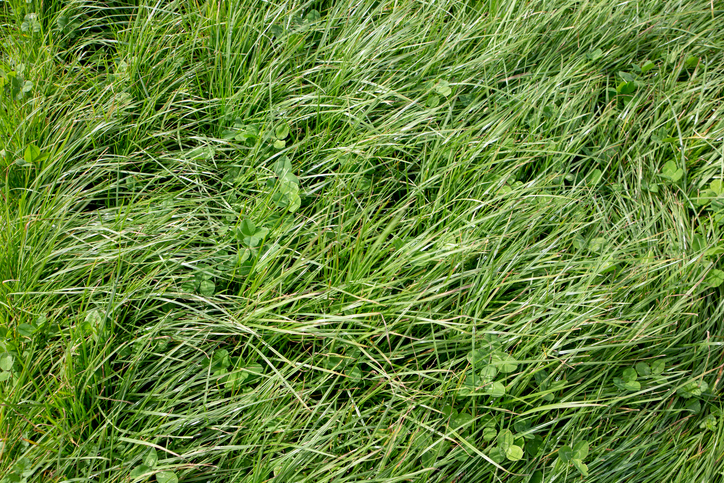
Find out how much drier your pasture could get by 2050 as the climate changes.
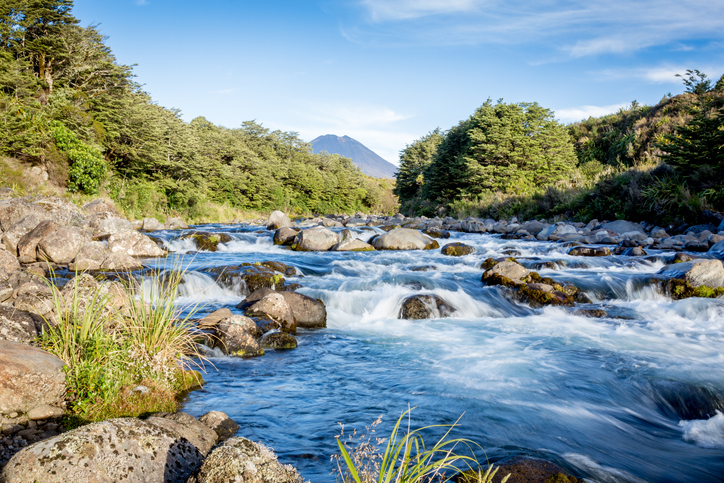
Explore how land use affects soil and water quality across New Zealand catchments.
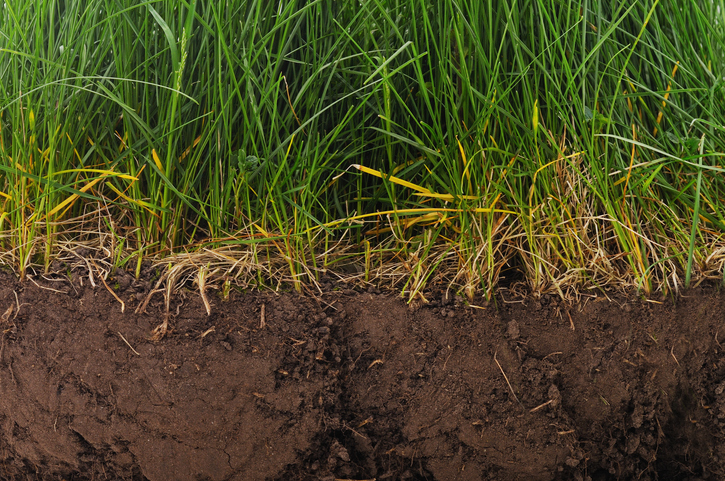
Find factsheets about how to manage different Northland soils.

An interactive tool to help you see how soil chemistry affects plant growth across Aotearoa.
Find out how well suited the whenua in your rohe is to growing potatoes.

Learn how trees improve farming in East Otago and support timber production.
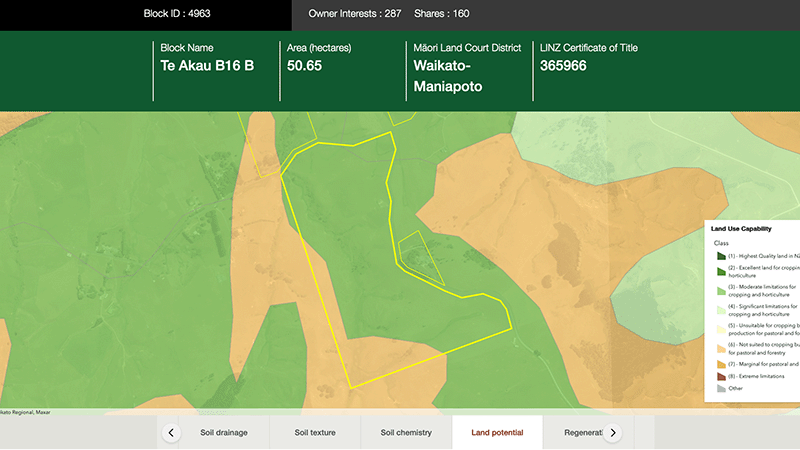
Explore different regulatory, soil, water, and land potential maps for your whenua.