Drought indicator charts
Climate
Risk
Water
View drought intensity data and charts for your region. Updated monthly.
The Rainfall Deciles map ranks historical rainfall totals for specific locations and months, dividing them into ten equal parts. It helps you see how current rainfall compares to past data, indicating potential drought when totals are in the lowest three deciles.
View drought intensity data and charts for your region. Updated monthly.
The SPI measures drought and wet conditions using recent rainfall data.
Find out how much drier your pasture could get by 2050 as the climate changes.
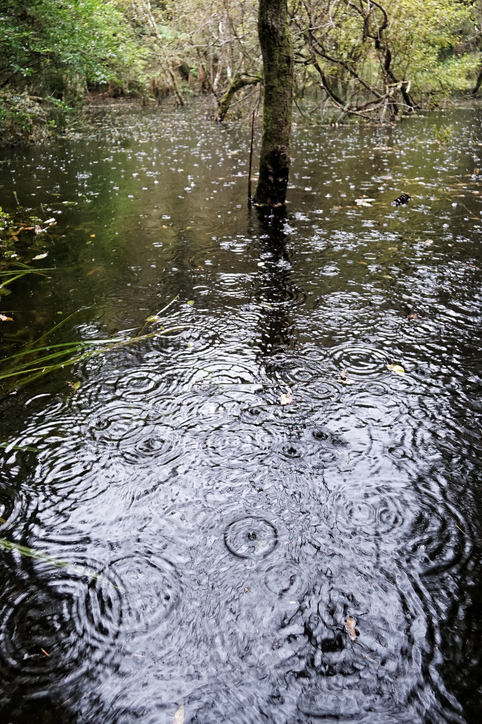
See how drought conditions and extreme rainfall in Aotearoa have changed as a result of climate change.
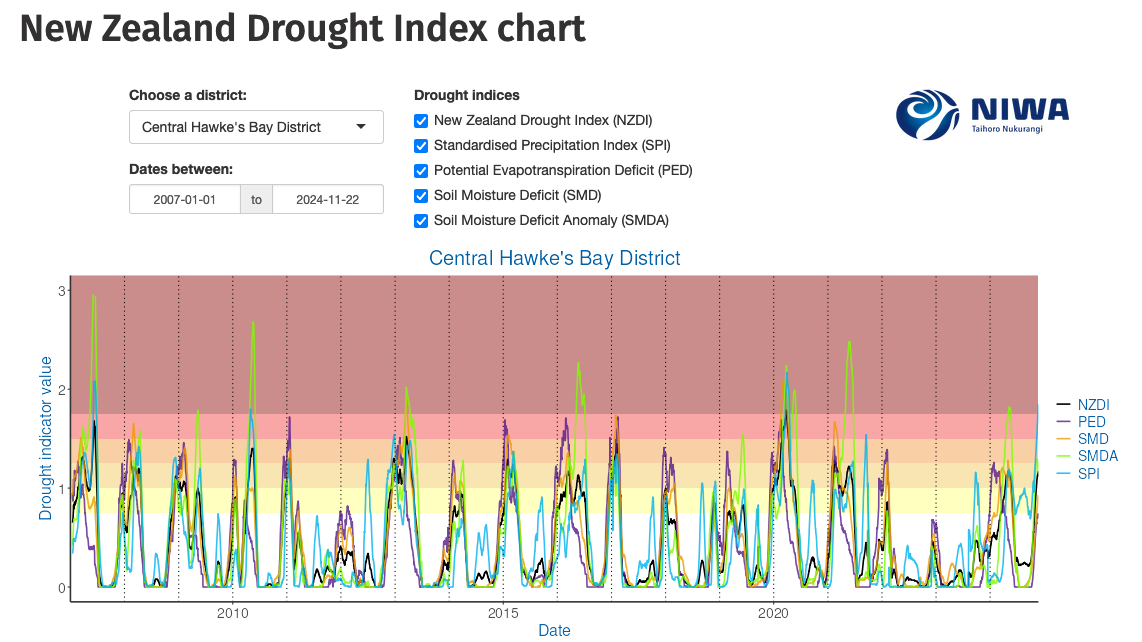
Monitor drought in New Zealand using key indicators and climate data. Access maps and downloads.

View rainfall data for Northland, showing monthly averages and percentages from gauges.
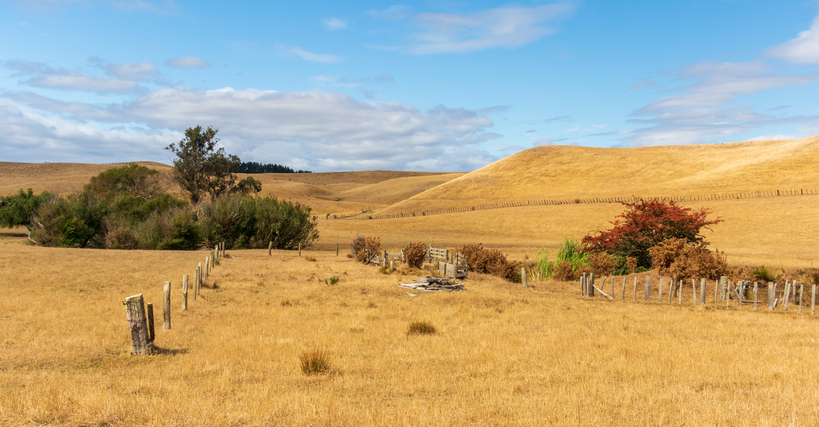
The NIWA Drought Forecasting Dashboard helps farmers track drought risk and rainfall for the next 35 days for better planning and decision-making.
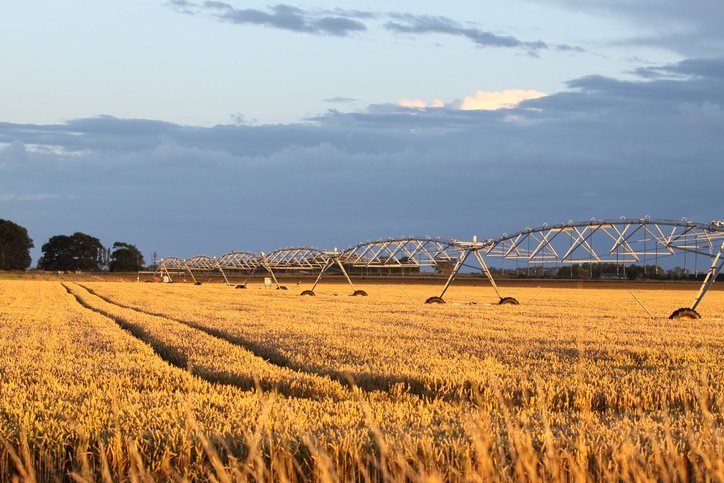
View soil moisture levels and drought indicators across the motu.
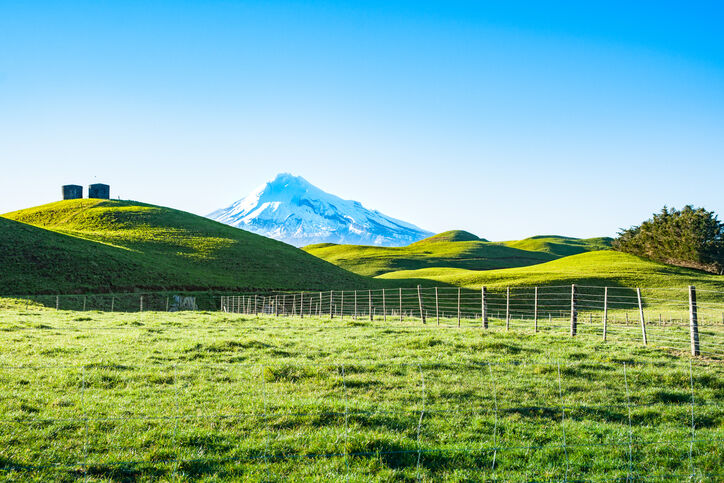
A report produced by NIWA, details climate change impacts and projections for Taranaki until 2100.
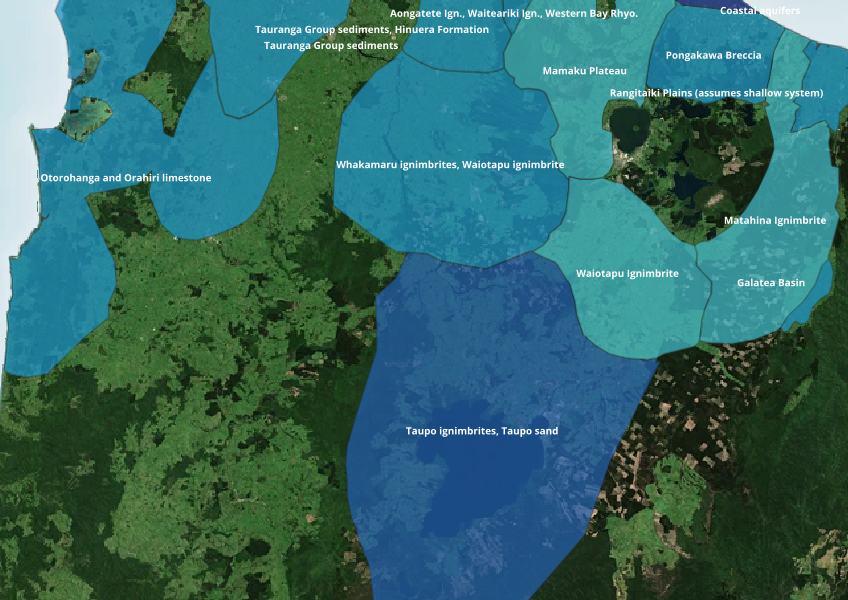
Find out where you might be able to access groundwater in your rohe.
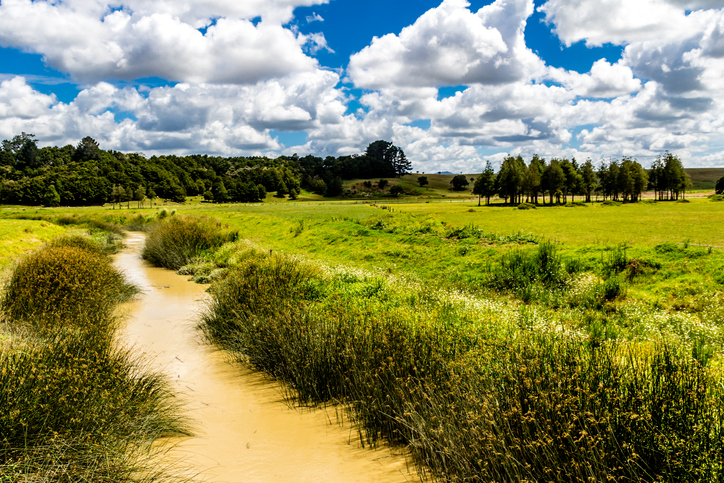
Check the E. coli runoff risk score for land in your rohe or catchment.
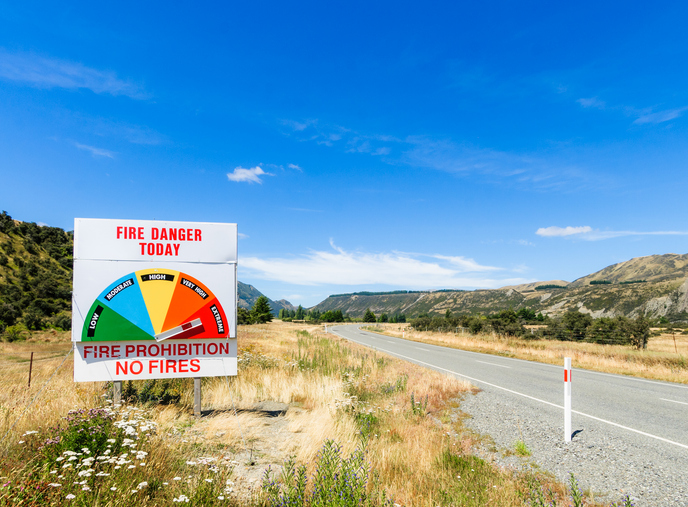
Learn about fire risks during droughts and how forestry insurance works in Aotearoa.
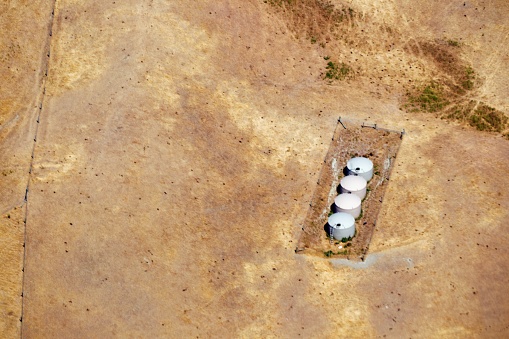
Explore drought impacts and find adaptation strategies for a changing climate.
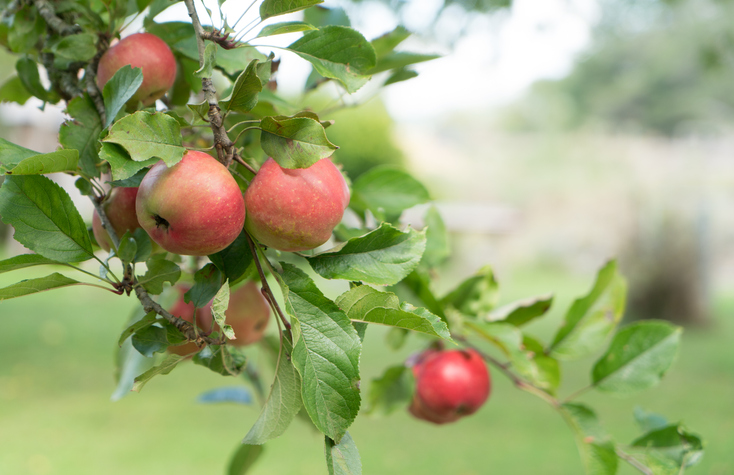
See how well suited the whenua in your rohe is to growing apples.
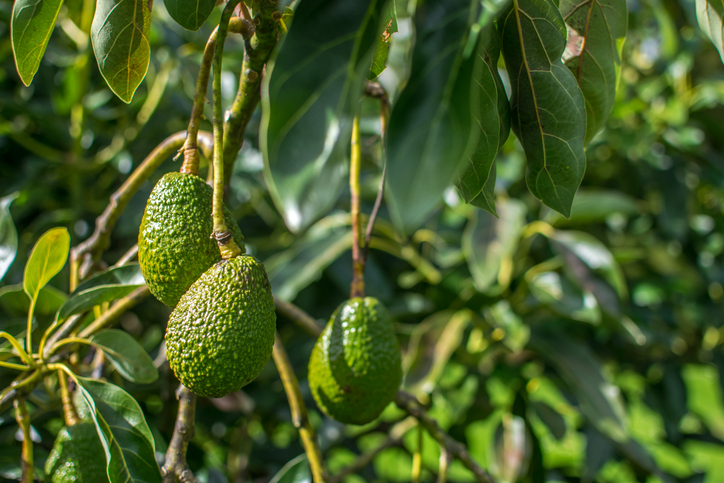
Find out how well suited the whenua in your rohe is to growing avocados.
Quickly and easily compare farm emissions data for different countries.
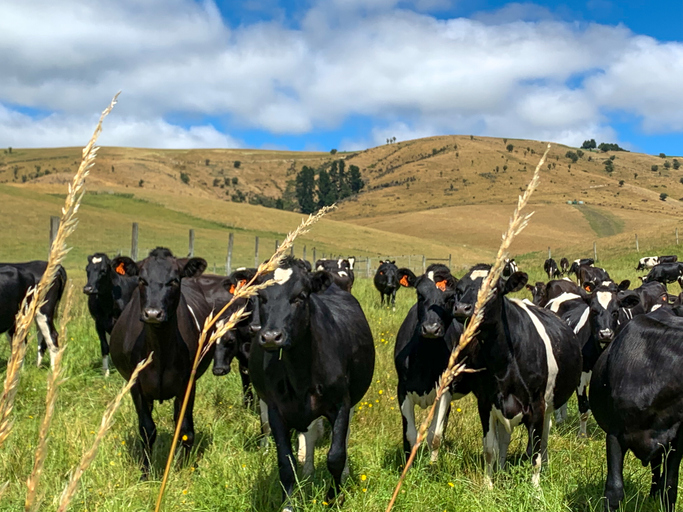
See how many hot days dairy cows in your rohe could face as the climate warms.
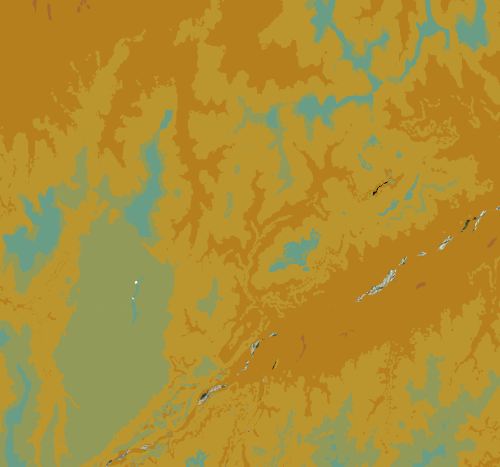
Check the historic average annual temperature for your whenua.
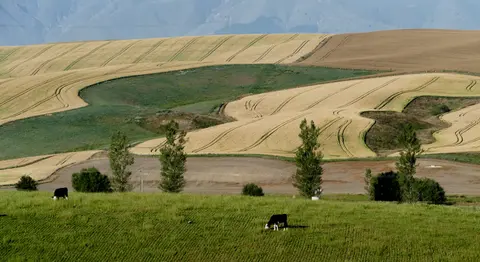
See how water shortfalls under maize could change as the climate warms.
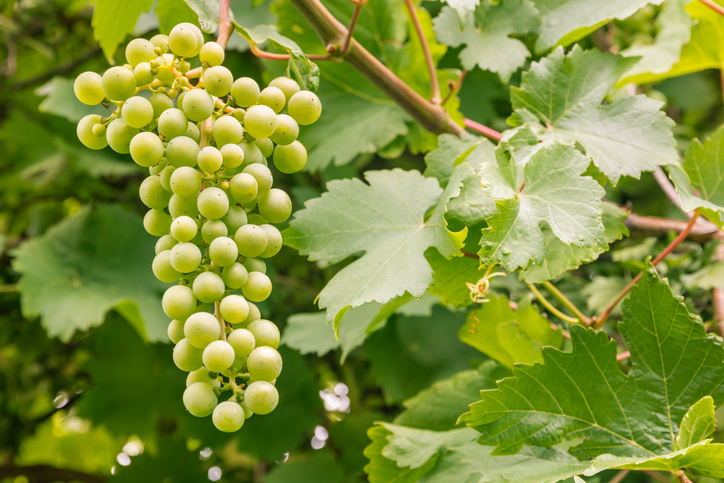
Compare how well suited the whenua in your rohe is to growing Sauvignon blanc grapes.
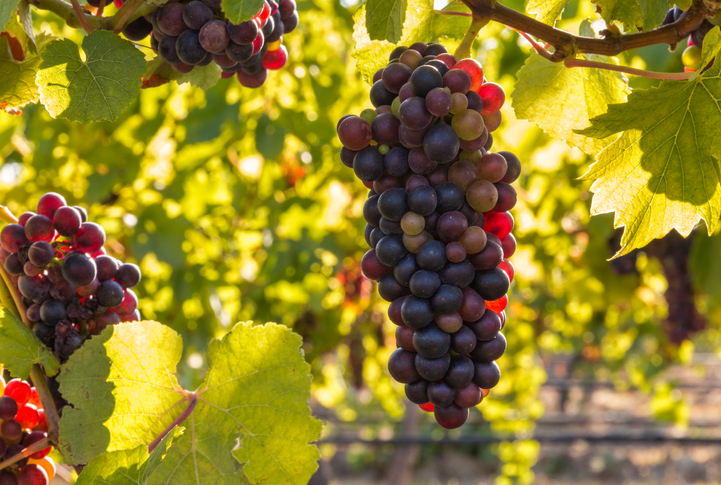
Check how well suited the whenua in your rohe is to growing Pinot noir grapes.
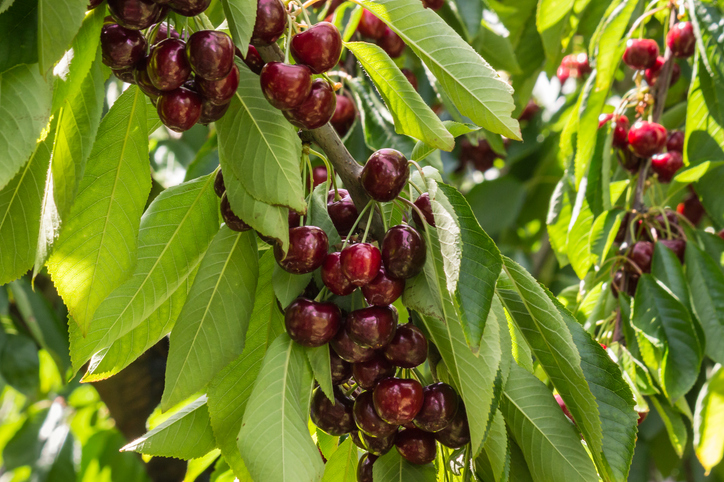
Explore how well suited the whenua in your rohe is to growing cherries.
Find out how well avocados could grow in your rohe by 2050 as the climate changes.