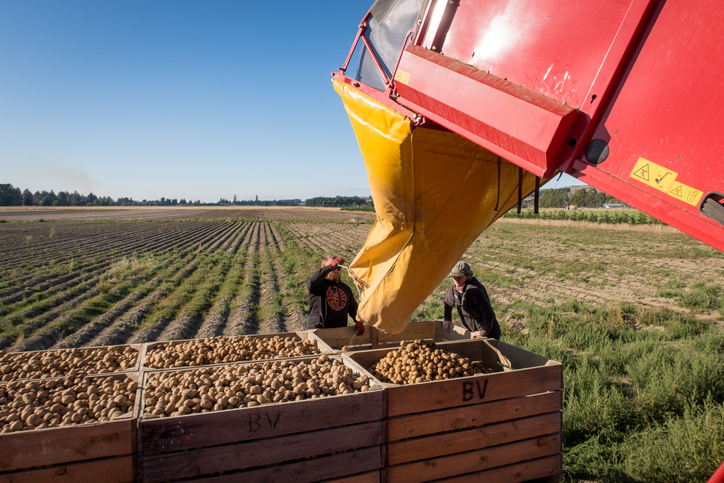
Potatoes - Critical climate risks
Climate
Adaptation
Horticulture
Risk
Learn how heat and frost risks for potatoes in your rohe could change over time.
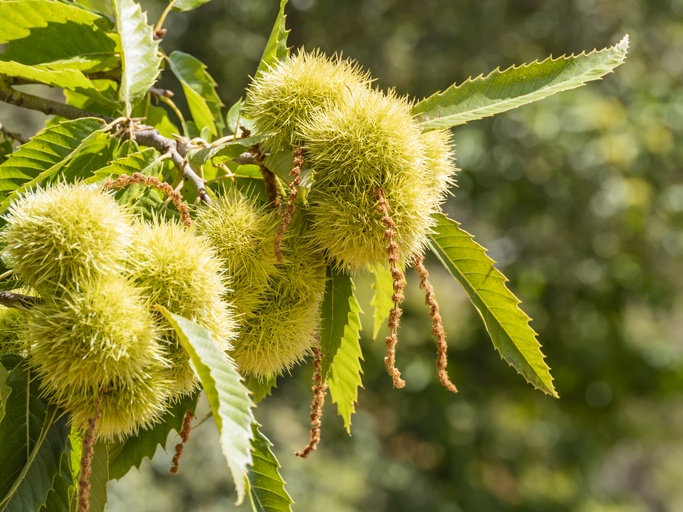
This dataset shows how often chestnuts could face damaging heat and frost during their most sensitive weeks of the growing season, and how that risk could change as the climate warms.
The map gives the number of days a year that a heat or frost threshold is crossed during those weeks. More days means more risk to the crop. For this dataset only the frost layer has actually been produced; the heat-stress layer is defined but has not yet been made. You can compare the recent past with two future periods, around 2050 and around 2090, across a range of possible futures from lower emissions through to one where the climate keeps warming at a high rate.
NIWA worked this out from six global climate models, run for each future and averaged together, on a 5 km grid across Aotearoa. The figures describe the climate only, not pests, disease or how the crop actually performs.
Learn how heat and frost risks for potatoes in your rohe could change over time.
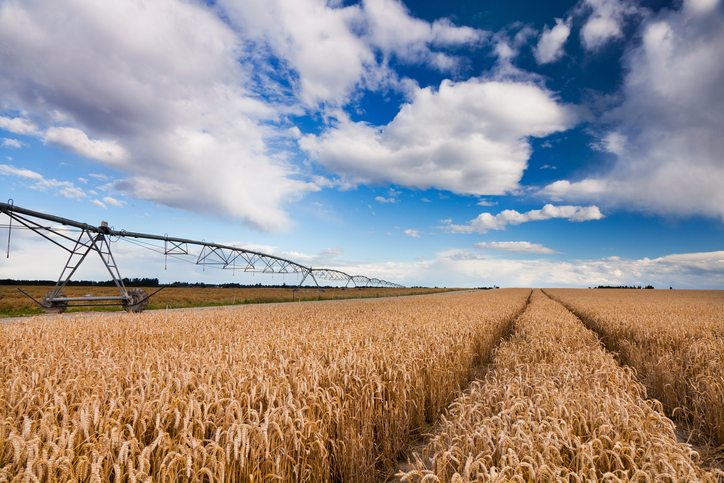
Check how often heat stress could hit wheat in your rohe as the climate changes.
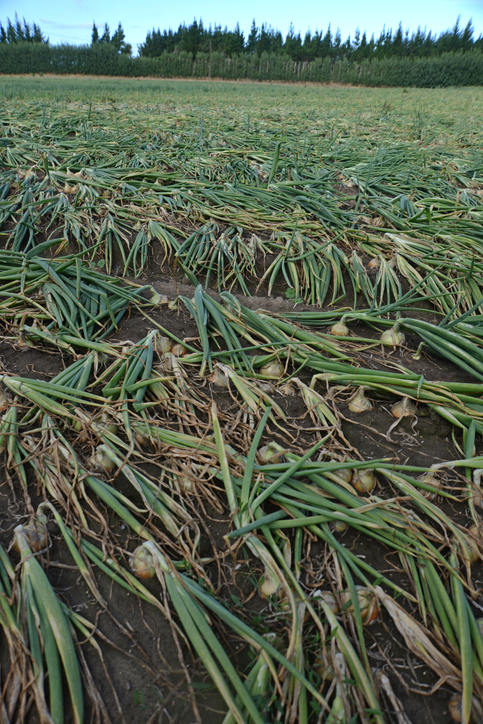
Discover how heat, frost and heavy rain could affect onions in your rohe.
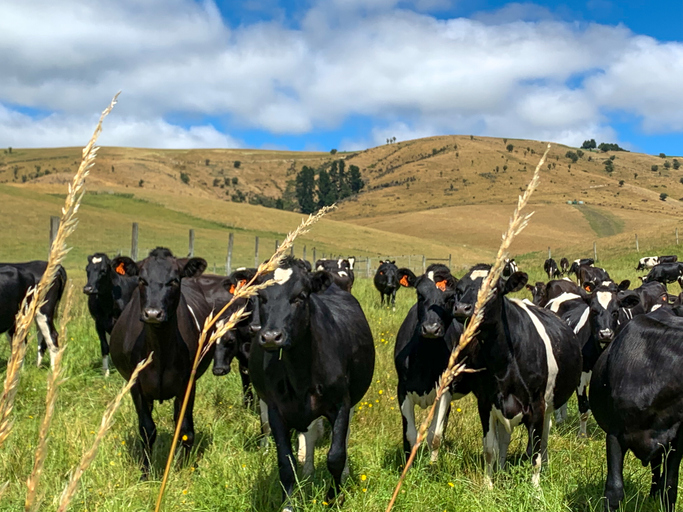
See how many hot days dairy cows in your rohe could face as the climate warms.
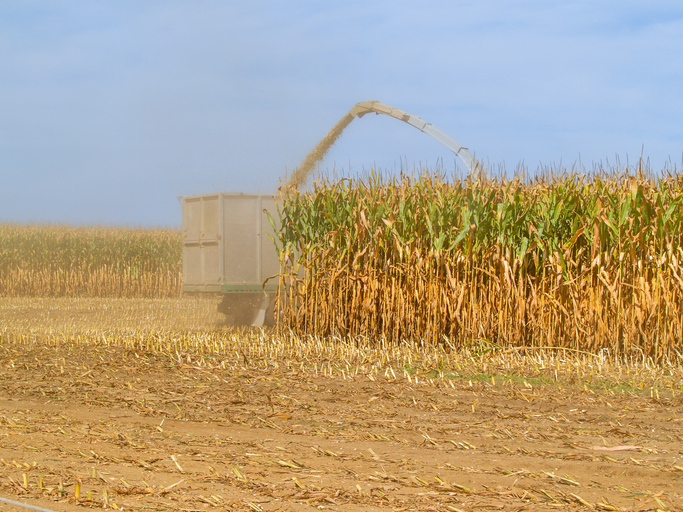
Find out how often heat stress could hit maize in your rohe as the climate changes.
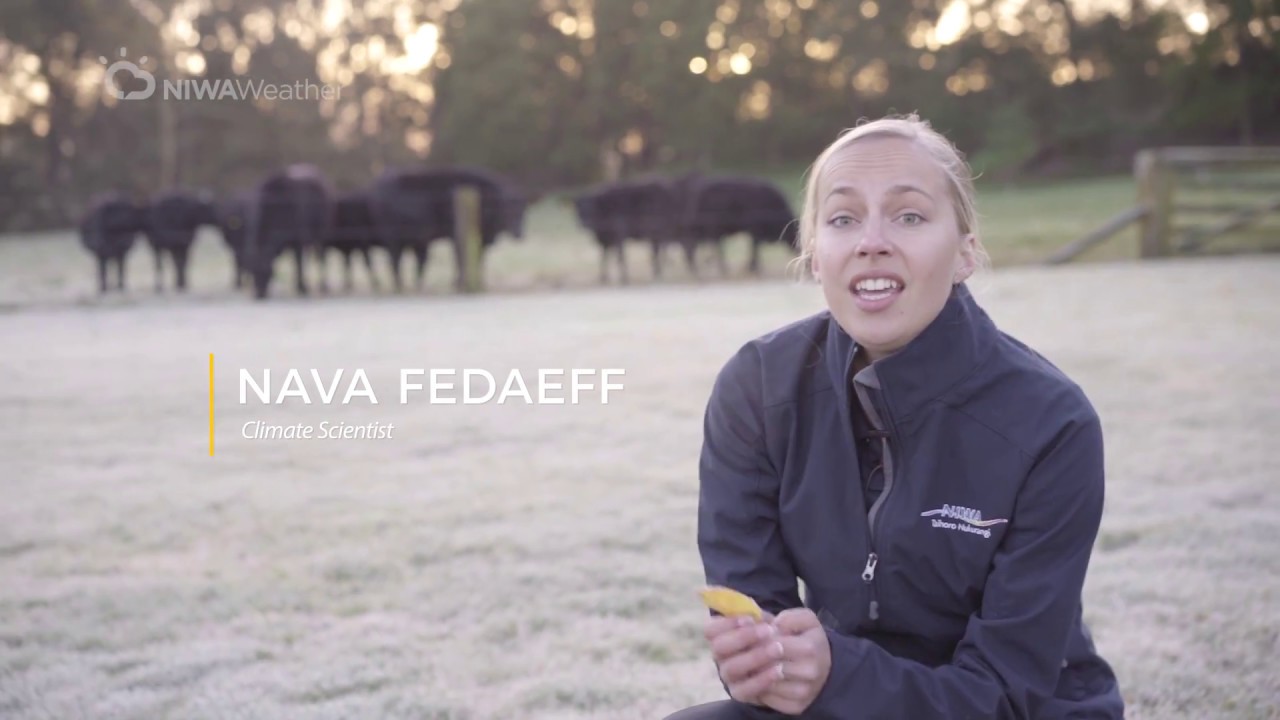
Climate Scientist Nava Fedaeff explores how frost is formed and how it impacts New Zealanders.
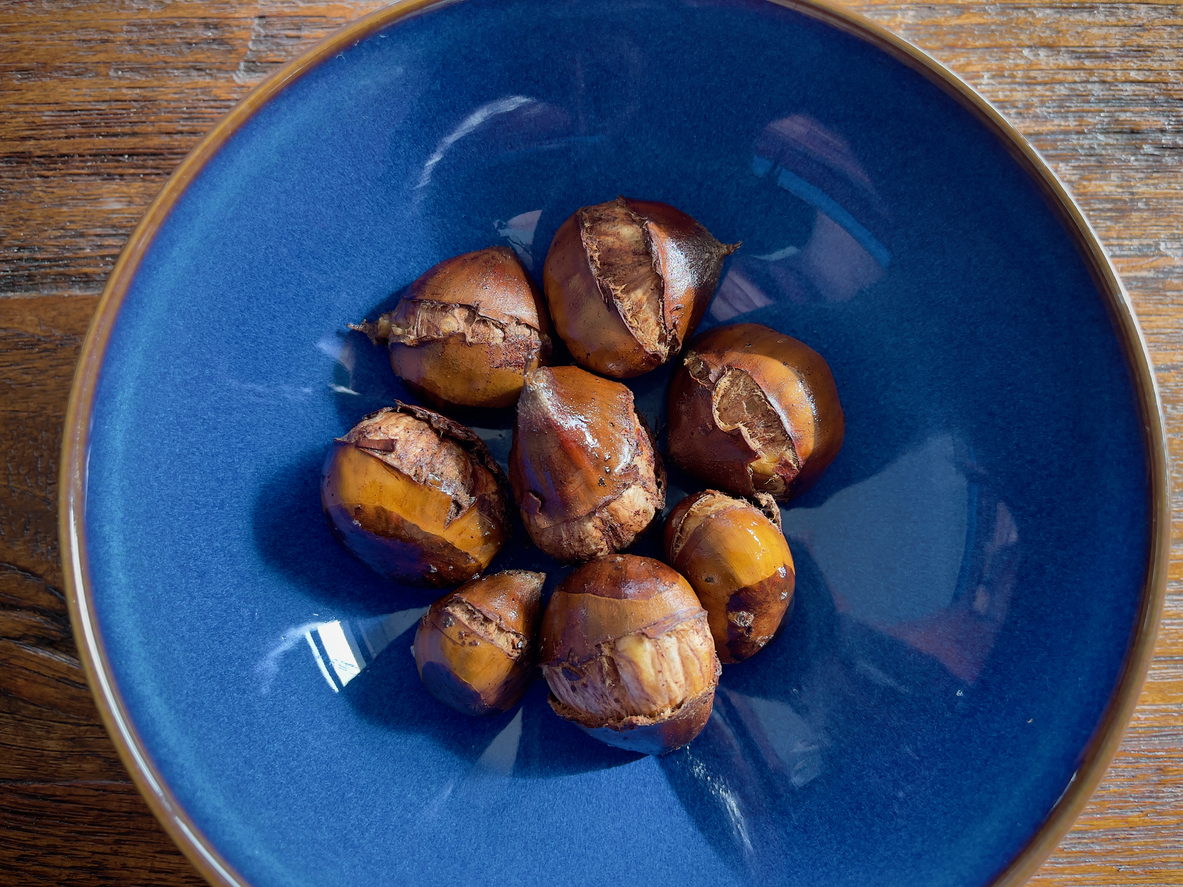
Learn how much chestnuts the whenua in your rohe could produce each year.
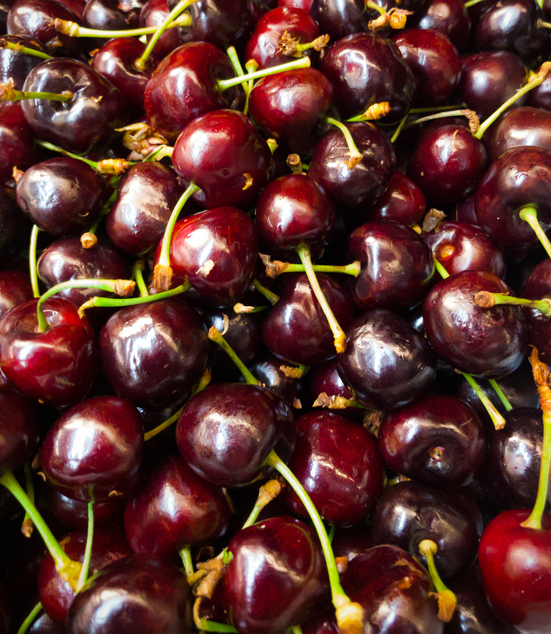
Explore how well cherries could grow in your rohe by 2050 as the climate changes.
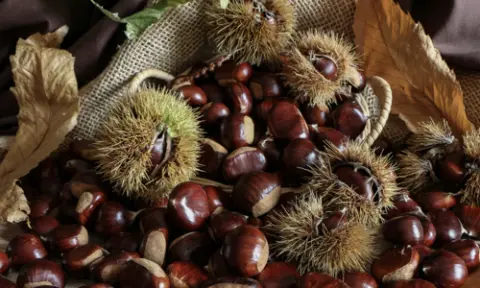
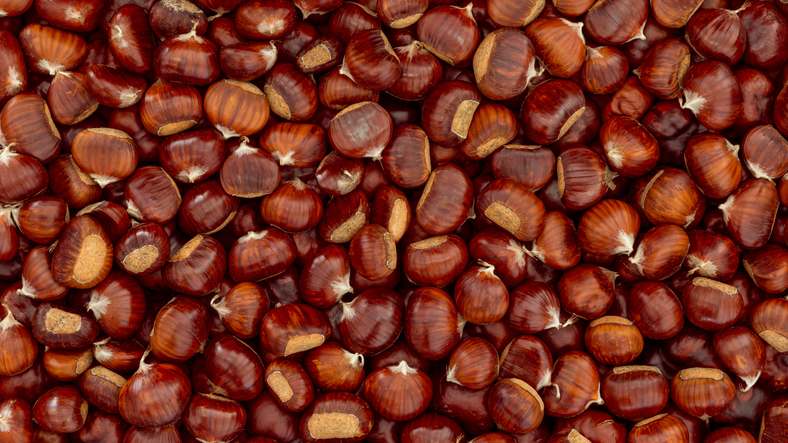
See how well suited the whenua in your rohe is to growing chestnuts.
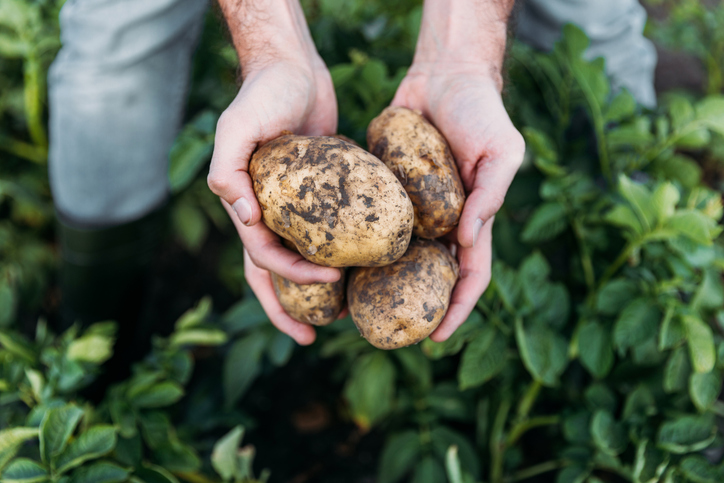
Check how much potatoes the whenua in your rohe could produce each year.
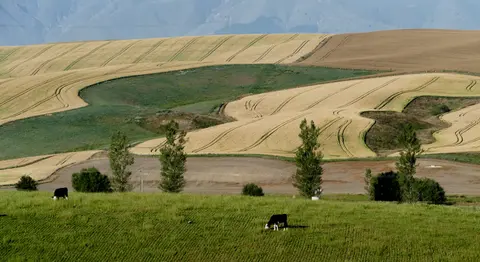
See how water shortfalls under maize could change as the climate warms.
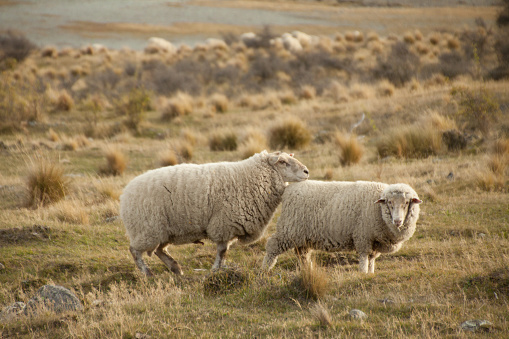
See how haemonchosis risk for your livestock could shift as the climate changes.
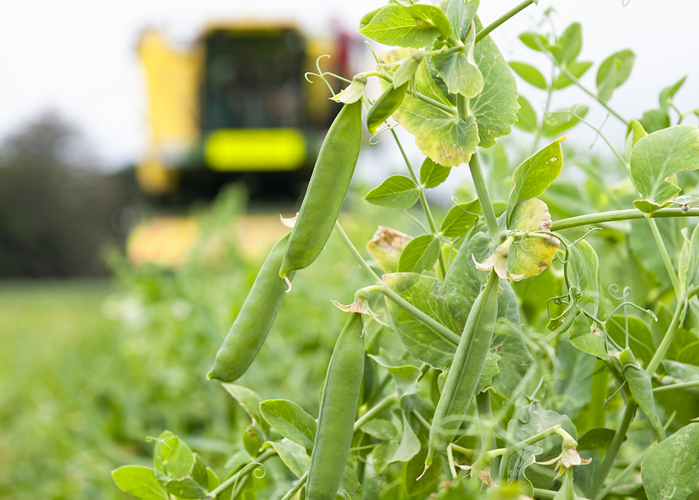
Explore how heat and frost risks for peas in your rohe could change over time.
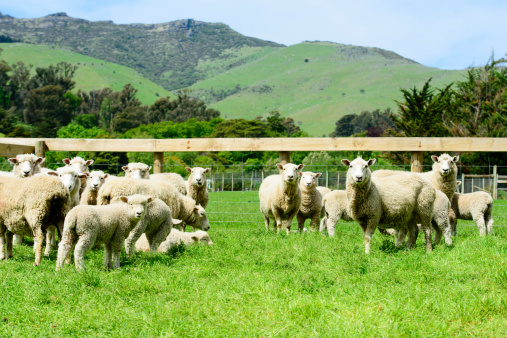
See how climate change could shift facial eczema risk for your livestock.
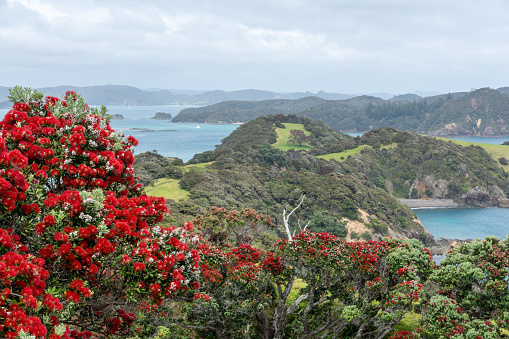
Explore projected temperature and rainfall changes for Aotearoa online.
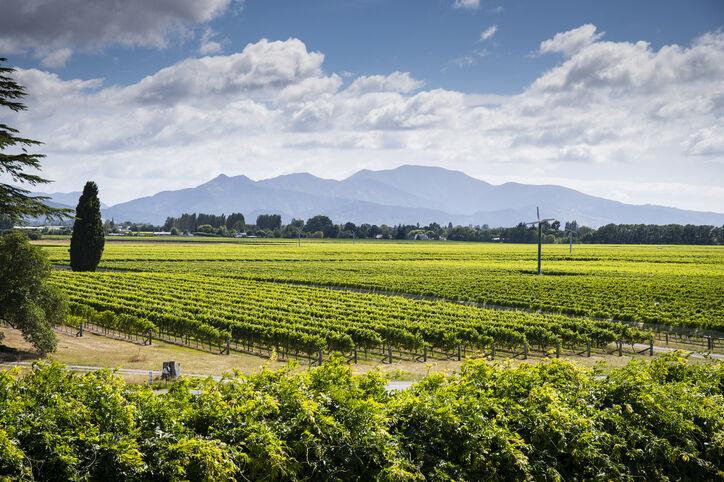
Explore how much growing season warmth your rohe could have by 2050.
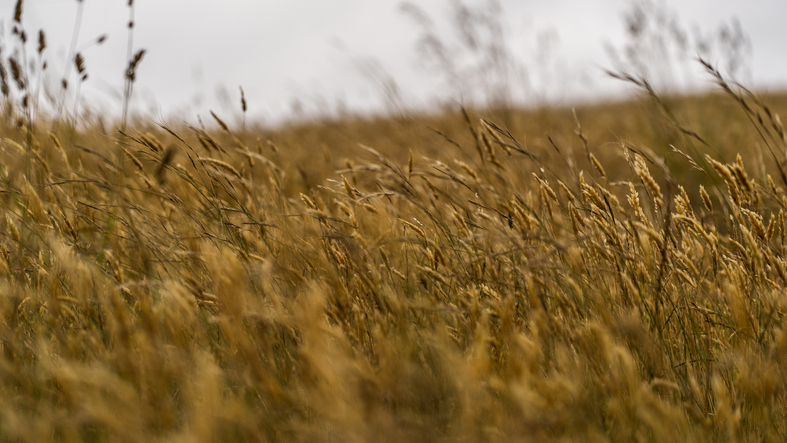
Track how sowing and harvest timing for maize could shift as the climate changes.
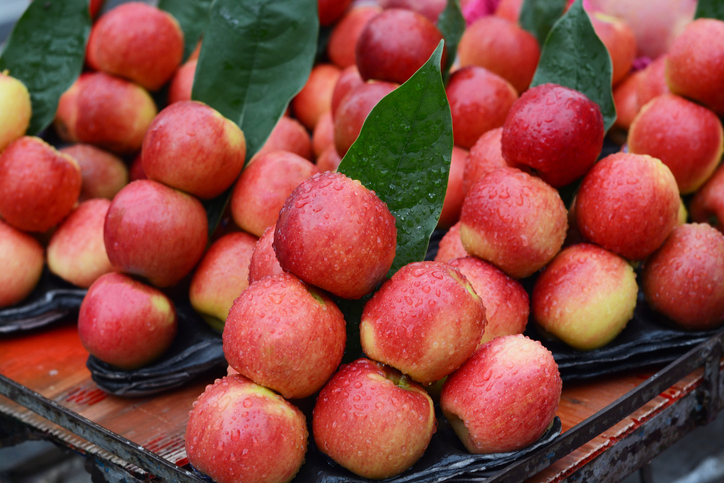
See how well apples could grow in your rohe by 2050 as the climate changes.
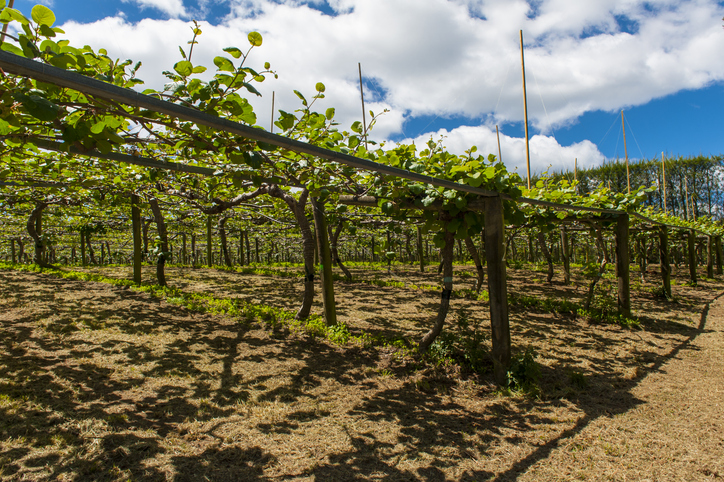
Learn how well kiwifruit could grow in your rohe by 2050 as the climate changes.

Check how forest fire danger in your rohe could change out to 2090.
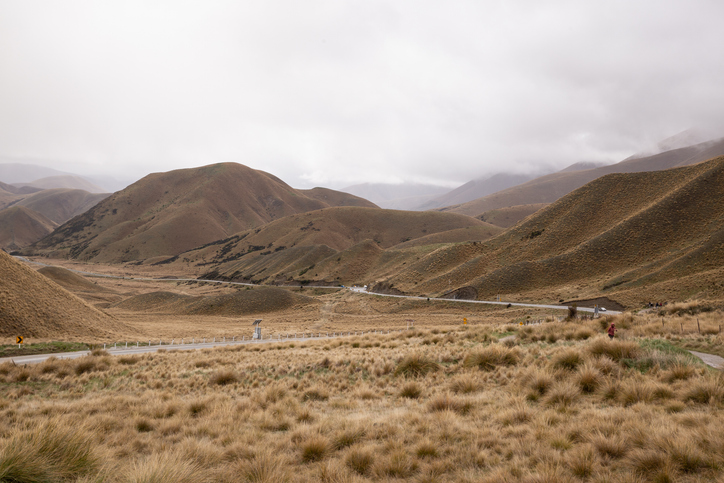
Find out how pasture growth on your land could change as the climate warms.
Find out how well avocados could grow in your rohe by 2050 as the climate changes.