Nitrogen leach susceptibility
Whenua
Emissions reduction
Farm planning
Fertiliser
Soil
Check how likely nitrogen is to leach through your soil
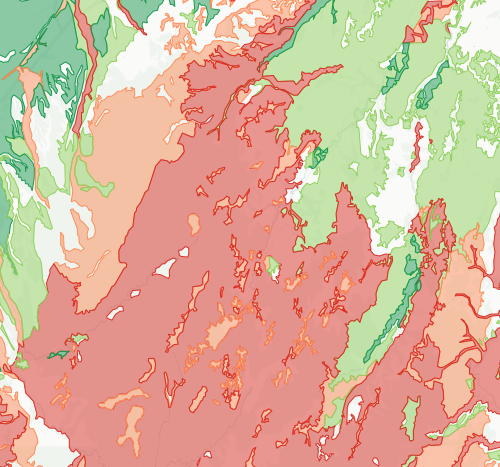
The Nitrate-nitrogen leaching from dairy livestock 2017 map shows how much nitrogen from dairy cattle is leaching into waterways. It provides a detailed view at a 100m resolution, helping you see areas around your farm where nitrogen pollution is higher or lower.
This information is useful for understanding the impact of your dairy farming practices on water quality. However, it only looks at nitrogen from livestock, not from fertilisers or other sources. Keep in mind that the data is based on average farming practices and is of medium accuracy so should be treated as an indicator only.
Check how likely nitrogen is to leach through your soil
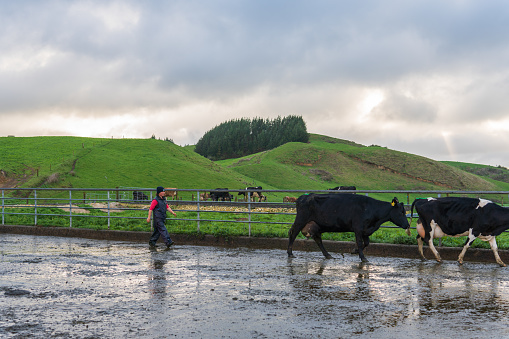
Access livestock manure data for N inputs and losses.
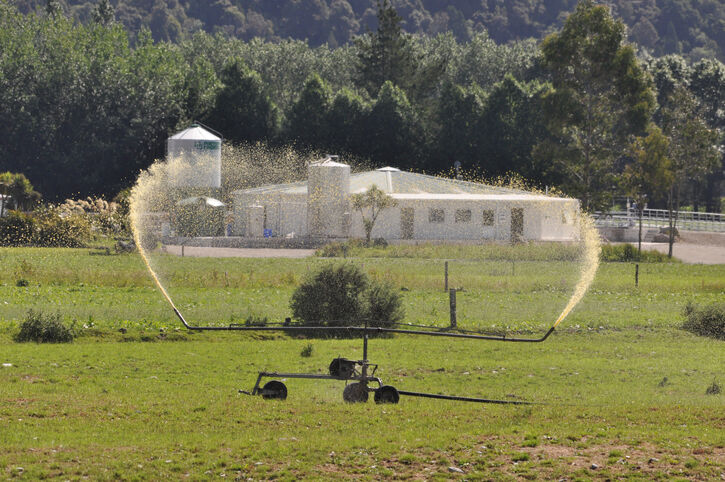
Find out about a no-cost method to reduce your dairy farm's greenhouse gas emissions.
See how much nitrogen your crop rotation could leach into the ground.
Explore maps showing how livestock density affects water quality in New Zealand rivers.
See how susceptible your soil and climate are to nitrogen loss each month.
Learn how to manage nitrogen fertiliser use for better pasture growth and environmental outcomes.
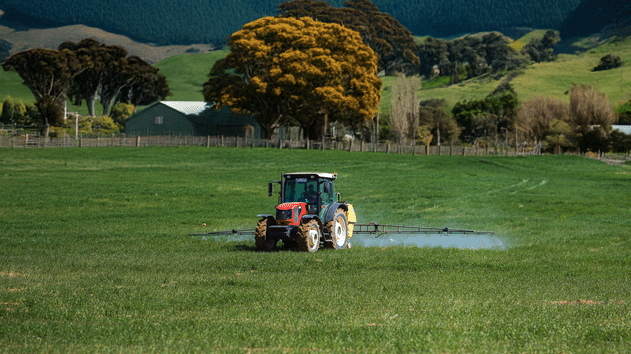
Use the N-Cap Webform to report synthetic nitrogen use on your dairy farm.
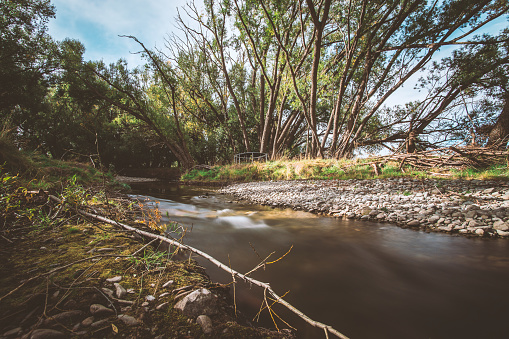
Guidance for dairy farmers on complying with the synthetic nitrogen fertiliser cap regulations.
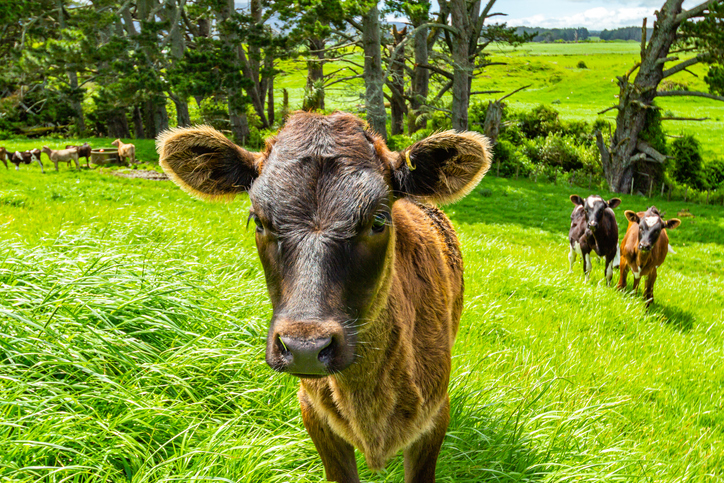
Compare nitrogen, phosphorus and greenhouse gas losses across dairy farm types.
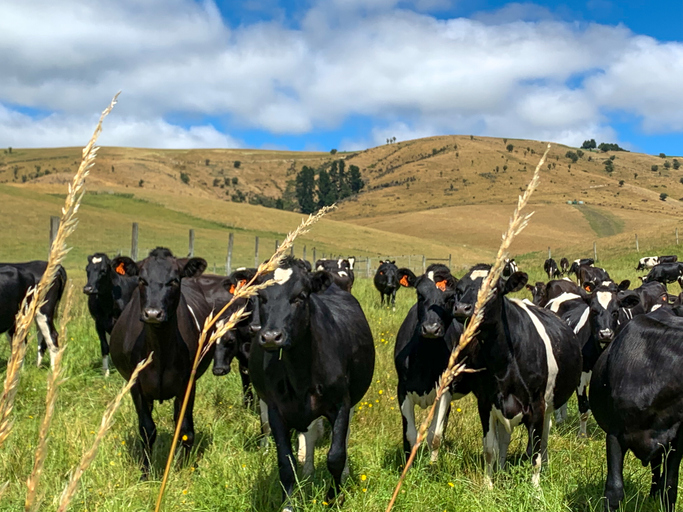
See how many hot days dairy cows in your rohe could face as the climate warms.
Learn about nitrous oxide, its effects, and ways to cut emissions in farming.
This guide explains how to cut nitrogen use, reducing nitrous oxide emissions on farms.
Learn about the terrestrial nitrogen cycle and the impacts of different farming activities.
Explore how land use changes affect water quality and nitrogen, phosphorus loads.
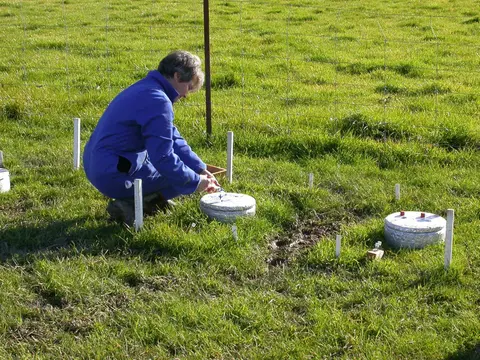
Learn how nitrogen management on farm can cut nitrous oxide losses.
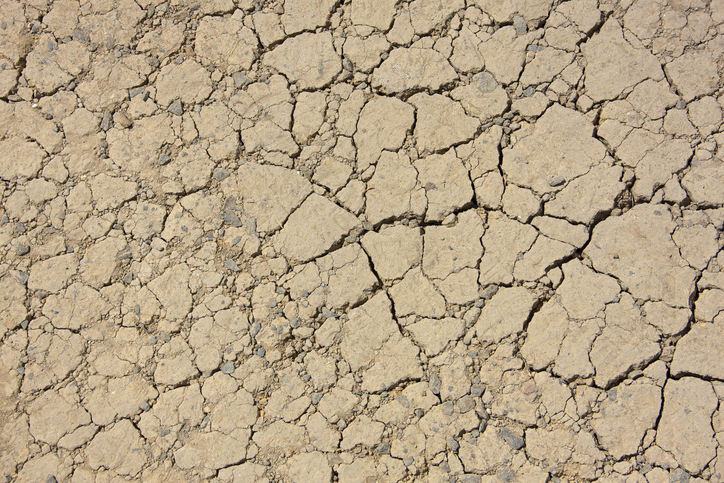
View drought intensity data and charts for your region. Updated monthly.
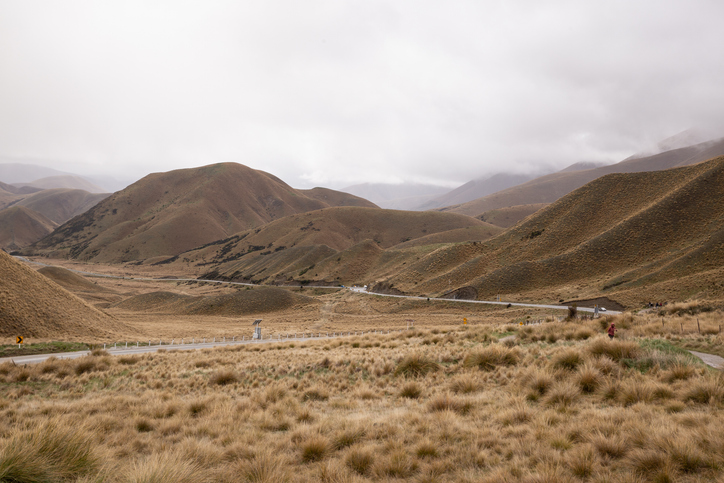
Find out how pasture growth on your land could change as the climate warms.
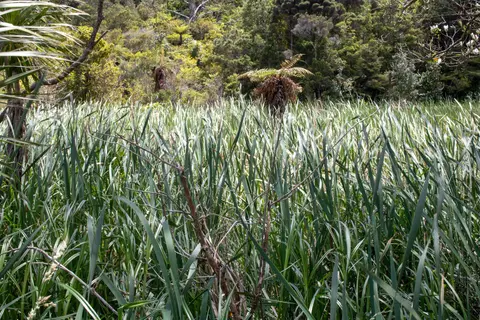
See how Owl Farm's constructed wetland strips nitrogen and sediment from farm runoff.
Using radiometrics and local knowledge to map how Southland's landscape affects water quality.
Learn how dairy farmers in New Zealand can reduce greenhouse gas emissions effectively.
Explore how Owl Farm has lowered nitrogen fertiliser use and modelled nitrogen loss.
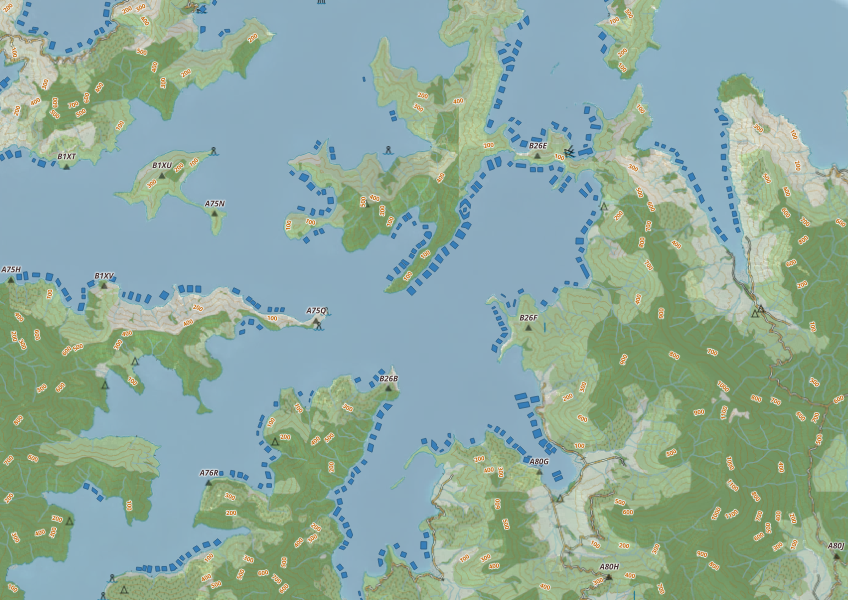
This map shows areas in Aotearoa that are used for aquatic farming.