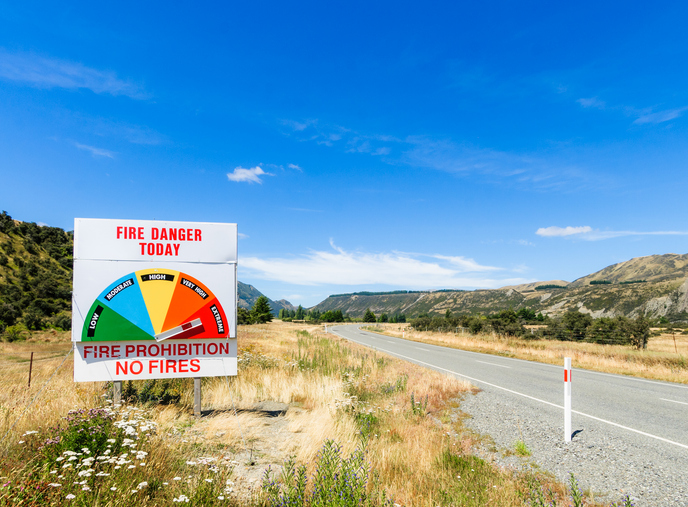
Drought and the increased risk of fire
Climate
Forestry
Risk
Learn about fire risks during droughts and how forestry insurance works in Aotearoa.
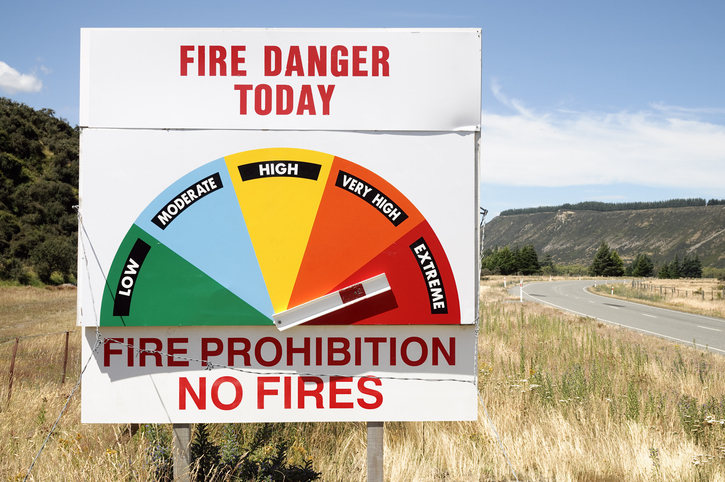
The NIWA Fire Indices Map provides national and regional forecasts of fire risk in Aotearoa.
It includes important data like rainfall, temperature, humidity, wind, and several fire danger ratings such as the Fire Weather Index and Forest Fire Danger.
Learn about fire risks during droughts and how forestry insurance works in Aotearoa.
Check how forest fire danger in your rohe could change out to 2090.
Learn how to reduce wildfire risks in rural areas and protect your property.
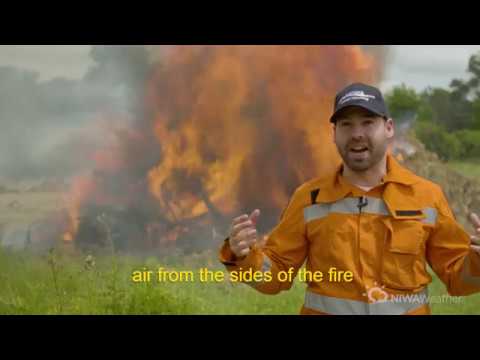
Learn more about what causes wildfires and how weather affects them.
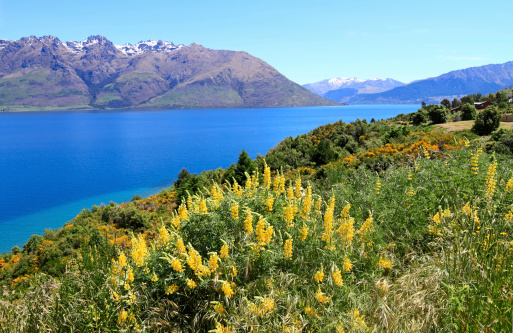
Annual climate summaries from NIWA provide key weather data and trends in New Zealand.
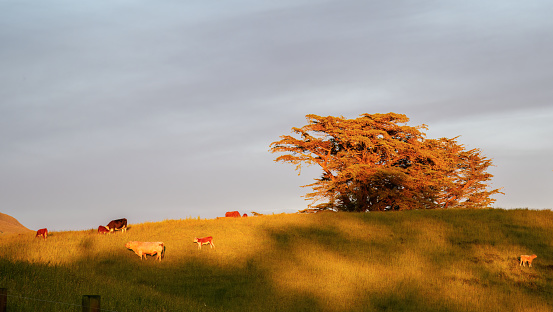
Get climate data to help make better decisions for your agribusiness.
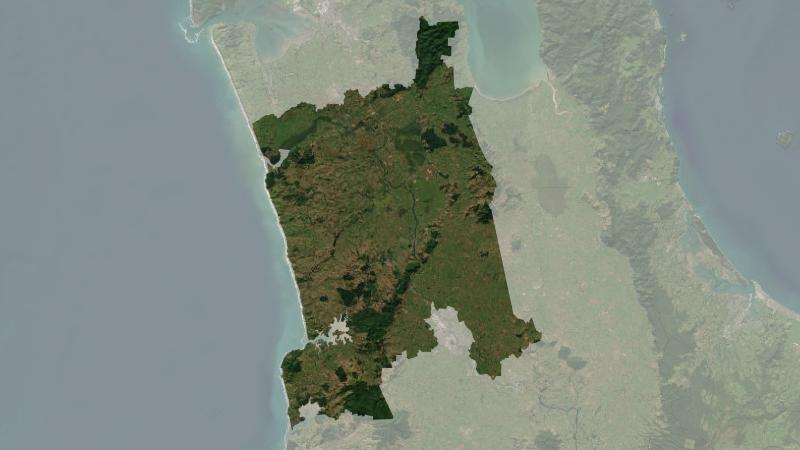
Understand climate event and variability trends for Waikato District.
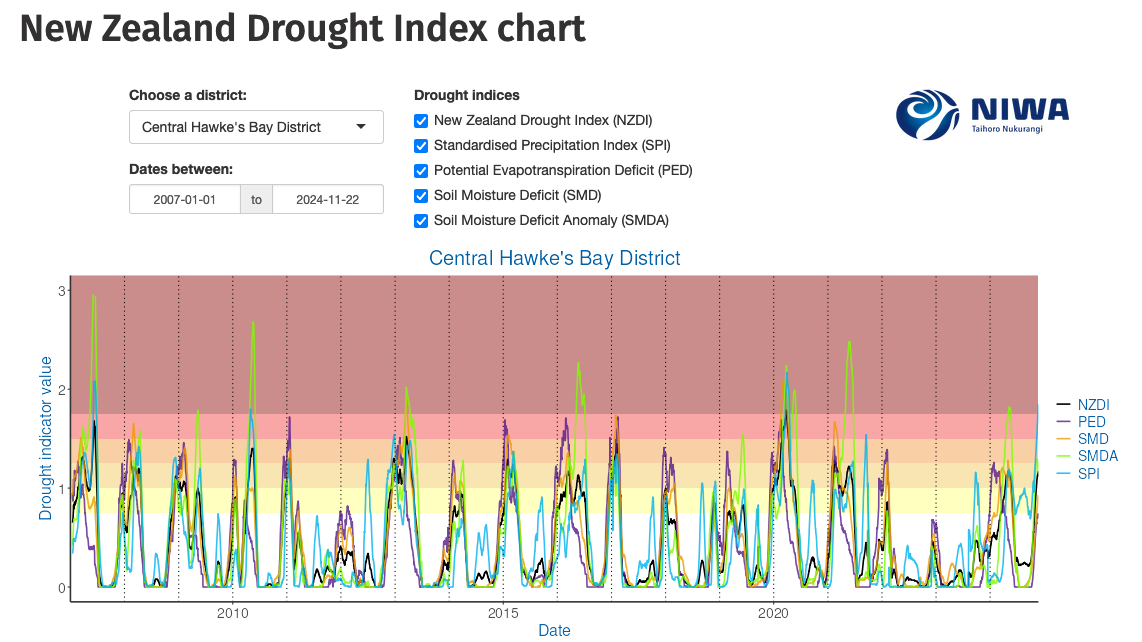
Monitor drought in New Zealand using key indicators and climate data. Access maps and downloads.
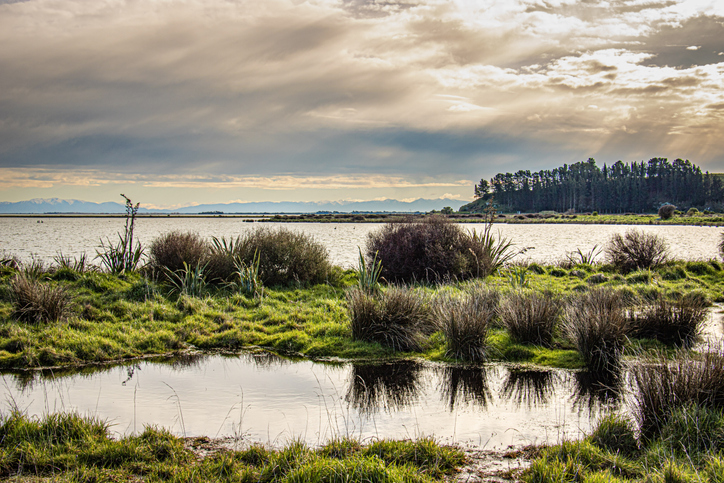
This resource details temperature changes in New Zealand and health risks linked to extremes.
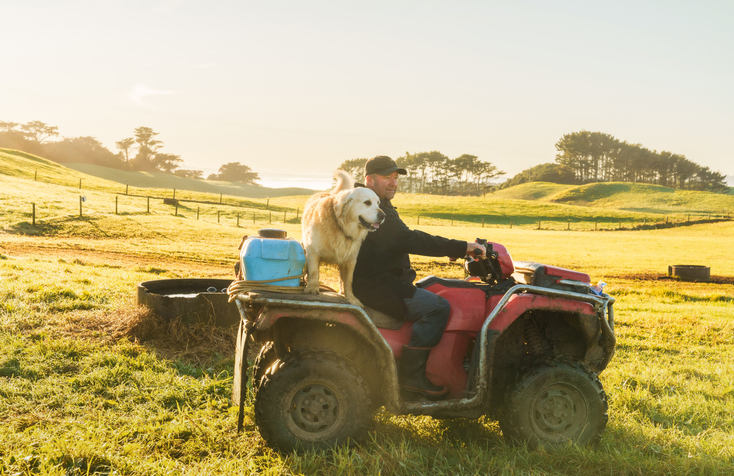
The DairyNZ Econ Tracker summarises key economic data for New Zealand dairy farmers.
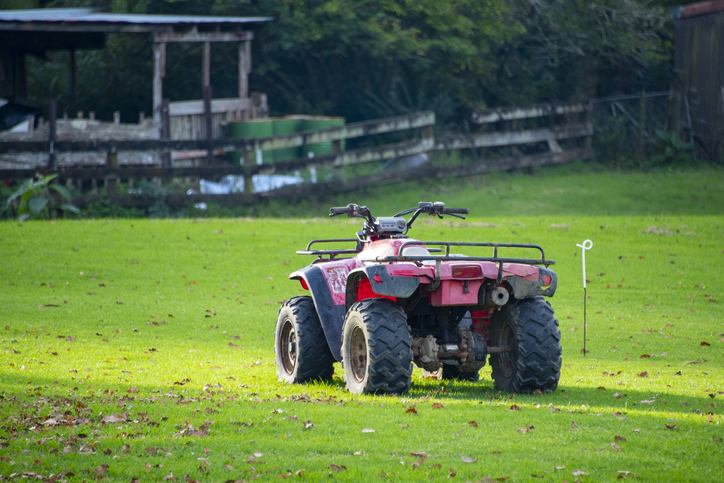
Free online learning modules to help you recognise and manage risks on the farm.
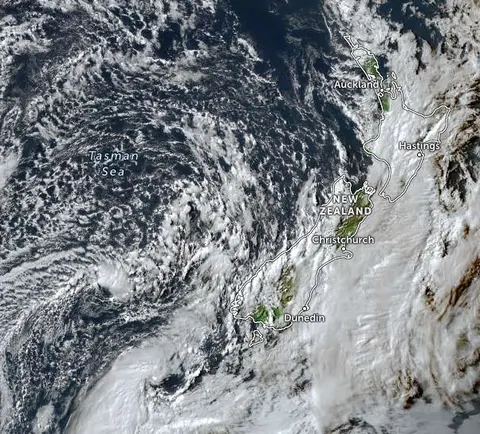
Zoom in on live satellite maps to check weather, floods, fire risk, and land changes in your rohe.
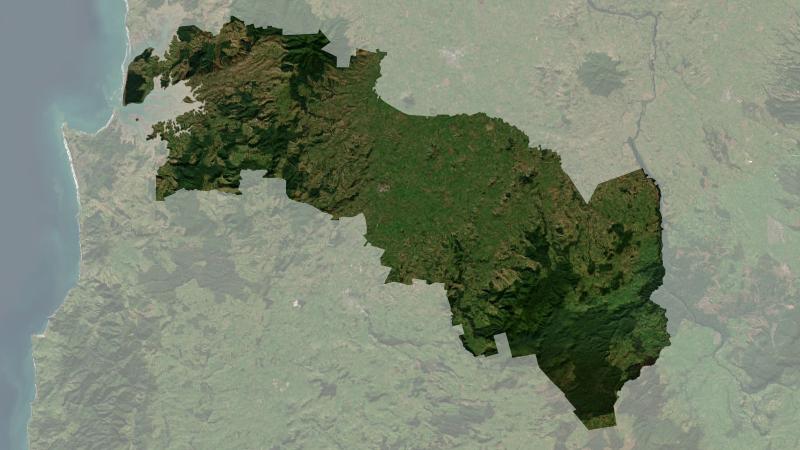
Understand climate event and variability trends for Ōtorohanga District.
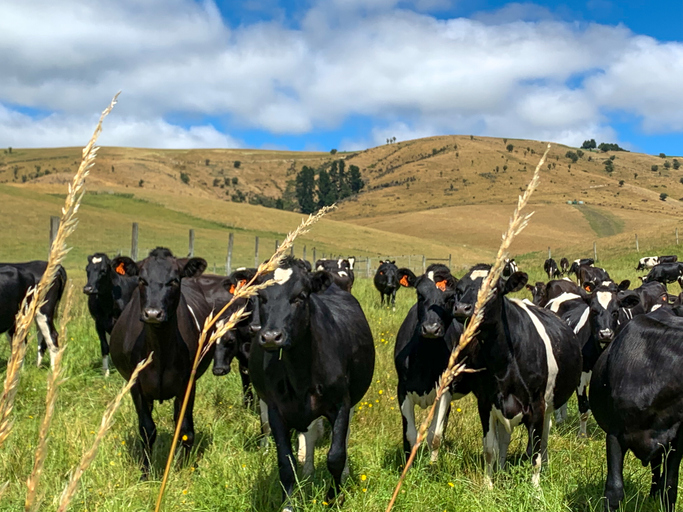
See how many hot days dairy cows in your rohe could face as the climate warms.
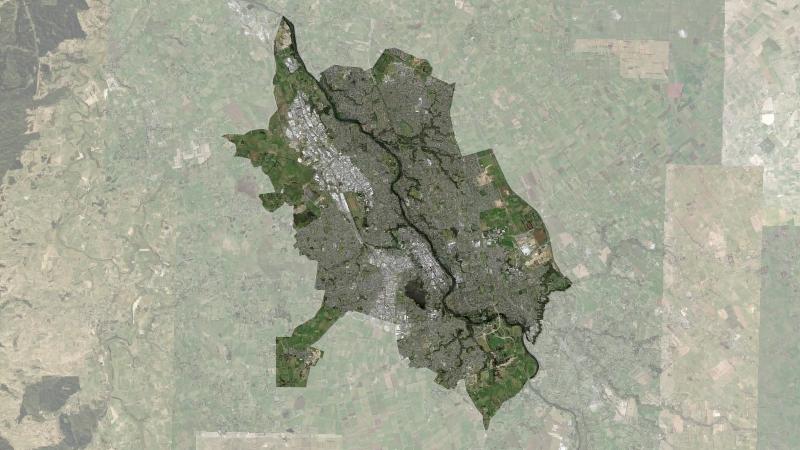
Understand climate event and variability trends for Hamilton.
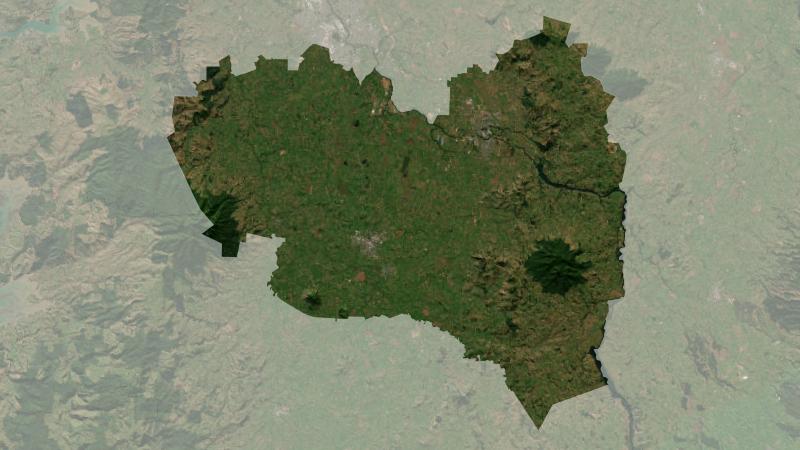
Understand climate event and variability trends for Waipa District.
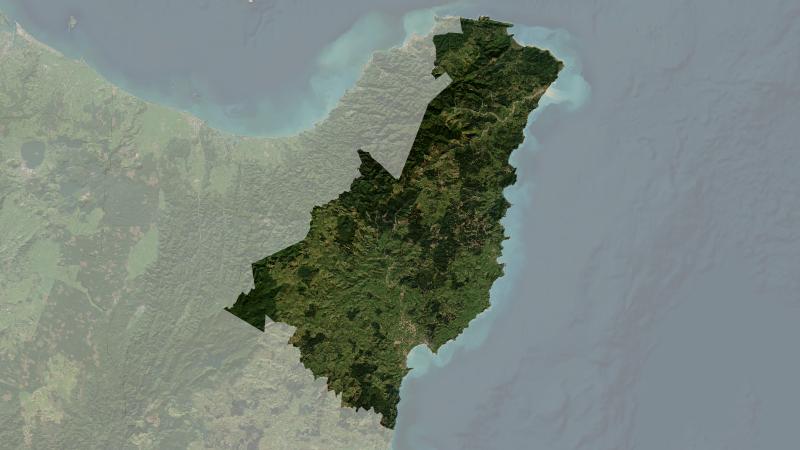
Understand climate event and variability trends for Gisborne District.
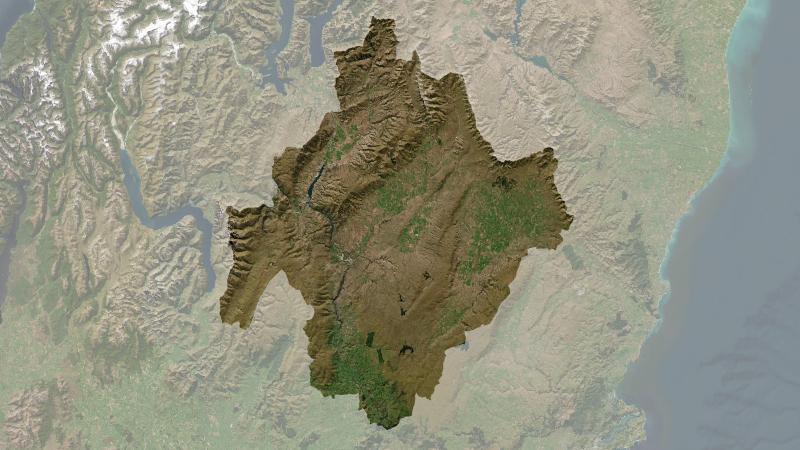
Understand climate event and variability trends for Central Otago District.
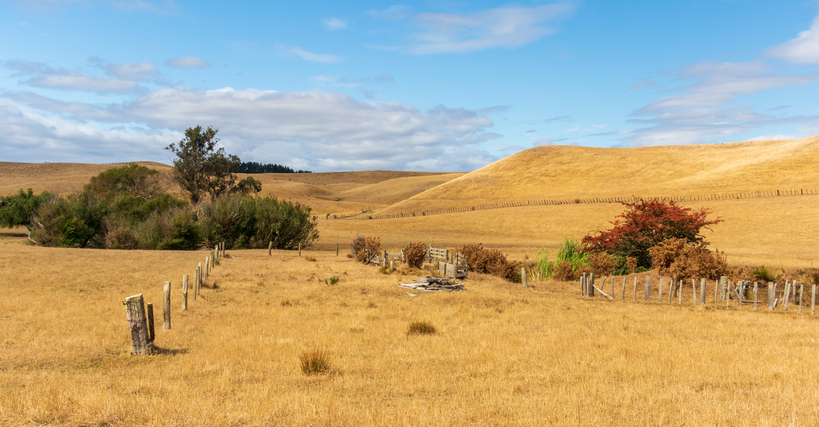
The NIWA Drought Forecasting Dashboard helps farmers track drought risk and rainfall for the next 35 days for better planning and decision-making.
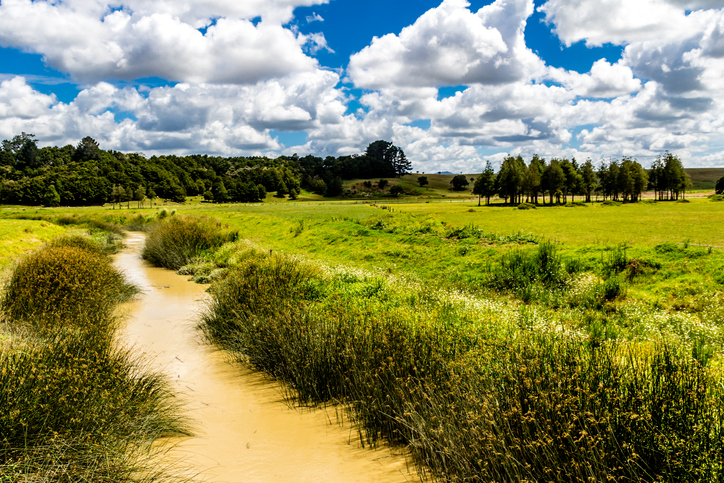
Check the E. coli runoff risk score for land in your rohe or catchment.
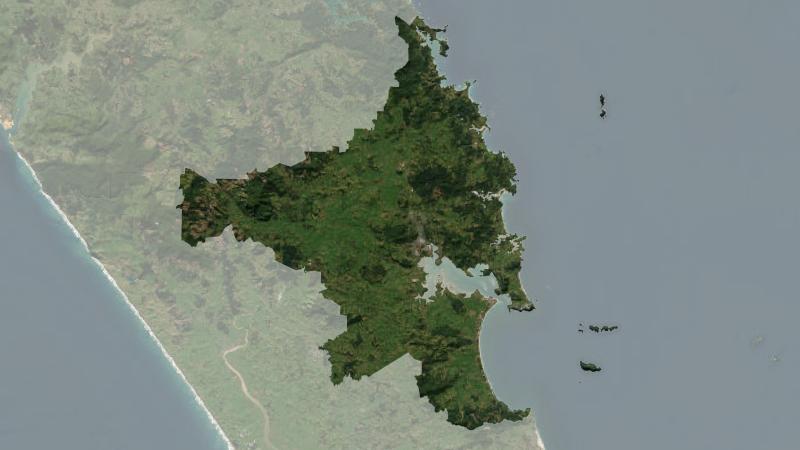
Understand climate event and variability trends for Whangarei District.
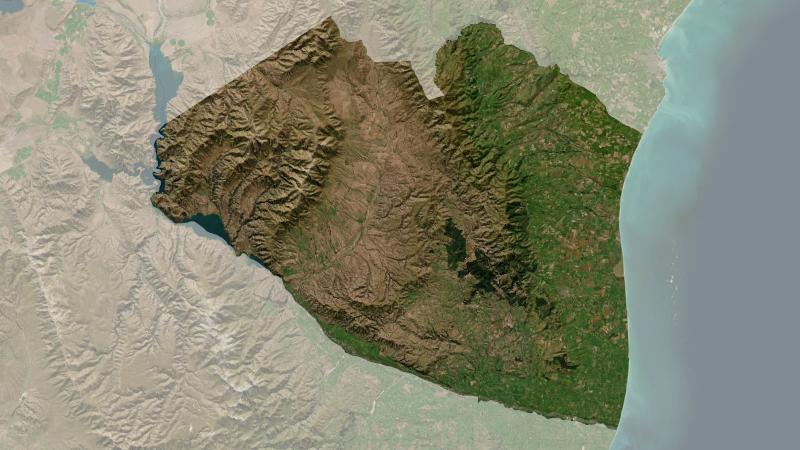
Understand climate event and variability trends for Waimate District.
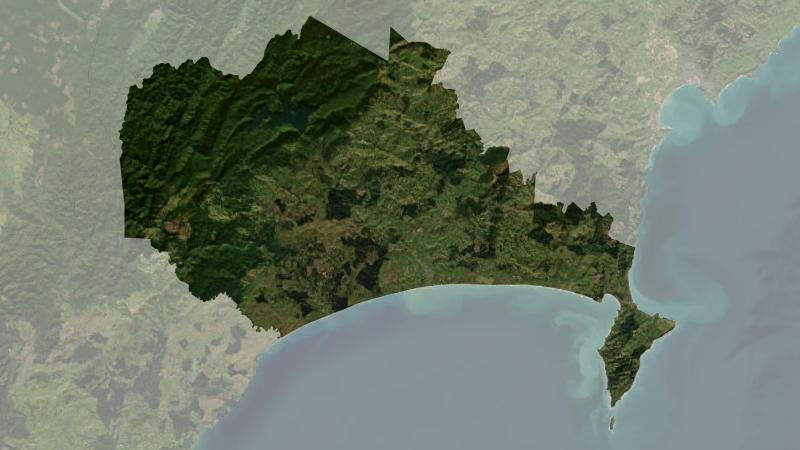
Understand climate event and variability trends for Wairoa District.