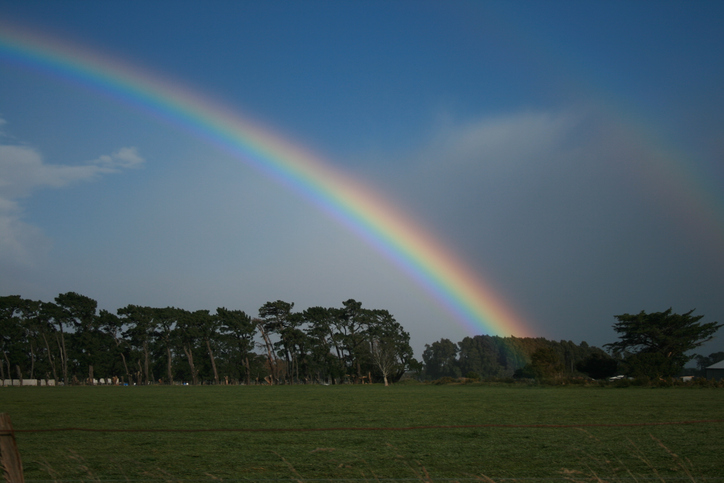
Rainfall deciles map
Climate
Adaptation
Planning
Risk
Water
See how recent rainfall in your rohe compares to historic records - a useful indicator for drought planning.
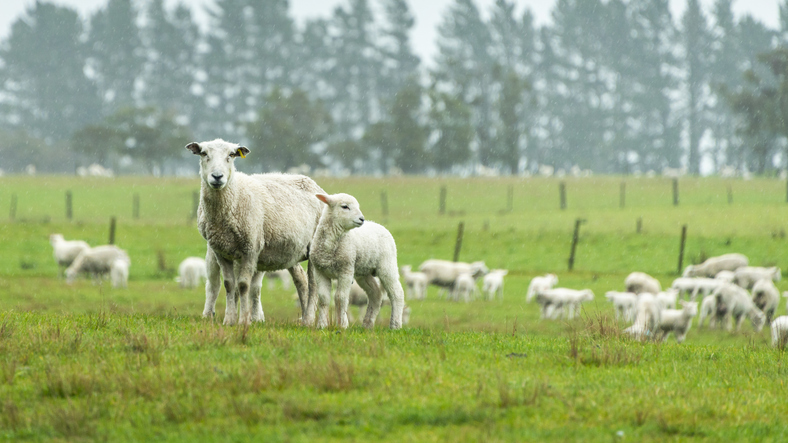
The Standardised Precipitation Index (SPI) measures drought and wet conditions based on recent rainfall compared to long-term averages. It shows how dry or wet an area is over the last 30 or 60 days, helping to identify potential droughts and the need for rainfall.
See how recent rainfall in your rohe compares to historic records - a useful indicator for drought planning.
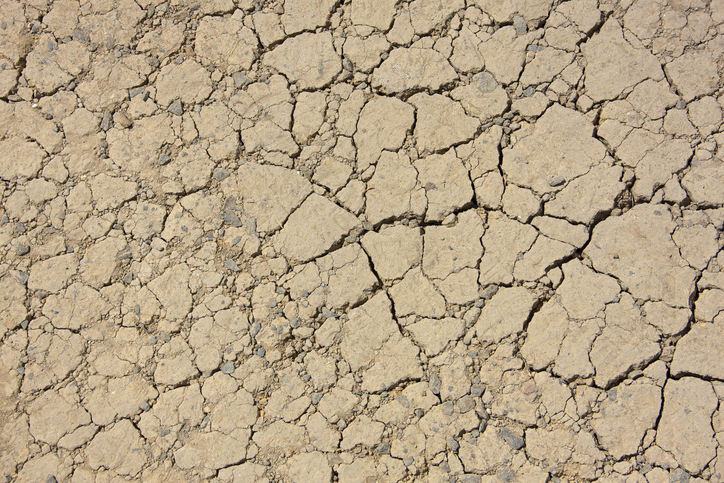
View drought intensity data and charts for your region. Updated monthly.
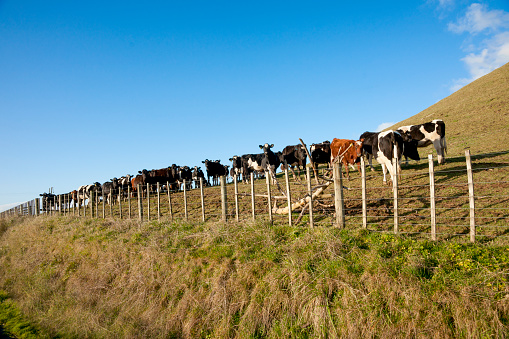
This research analyses future drought risks due to climate change impacts.

View rainfall data for Northland, showing monthly averages and percentages from gauges.
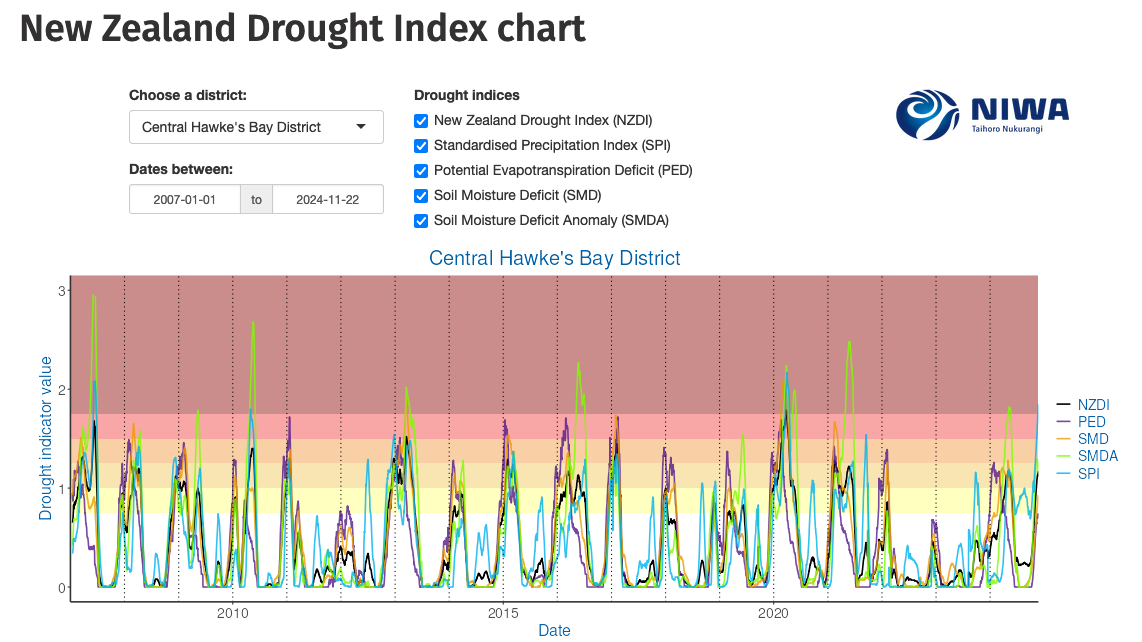
Monitor drought in New Zealand using key indicators and climate data. Access maps and downloads.
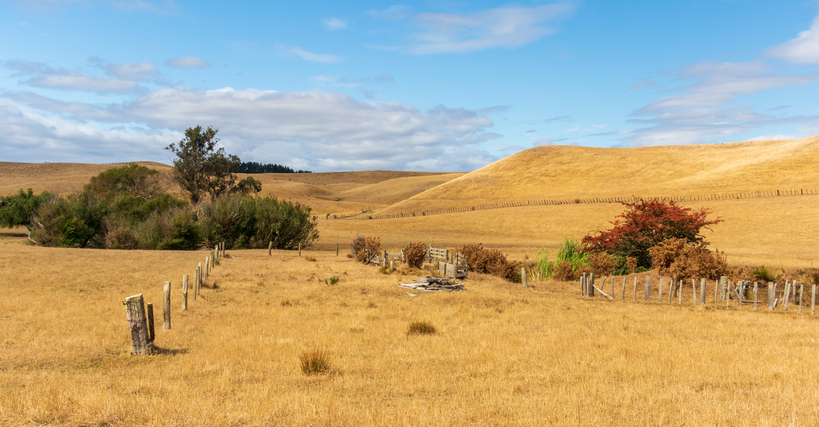
The NIWA Drought Forecasting Dashboard helps farmers track drought risk and rainfall for the next 35 days for better planning and decision-making.
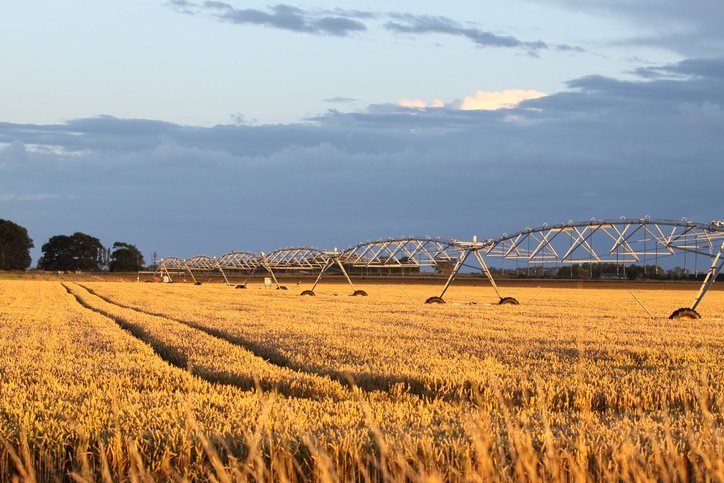
View soil moisture levels and drought indicators across the motu.
See how drought conditions and extreme rainfall in Aotearoa have changed as a result of climate change.
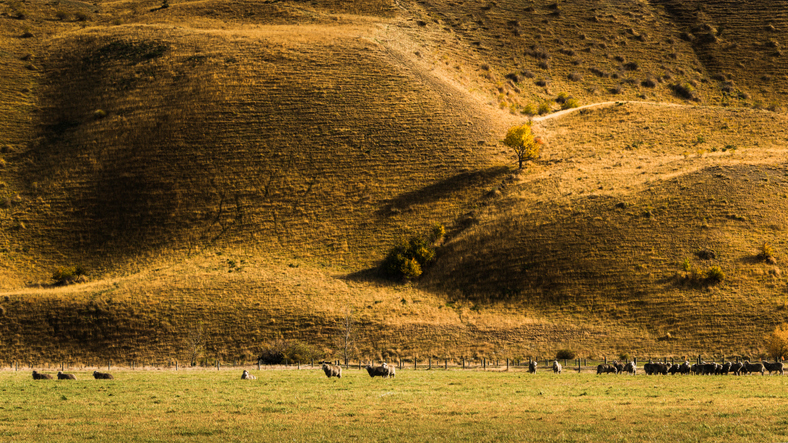
View maps showing average soil moisture deficit onset and termination dates across New Zealand.
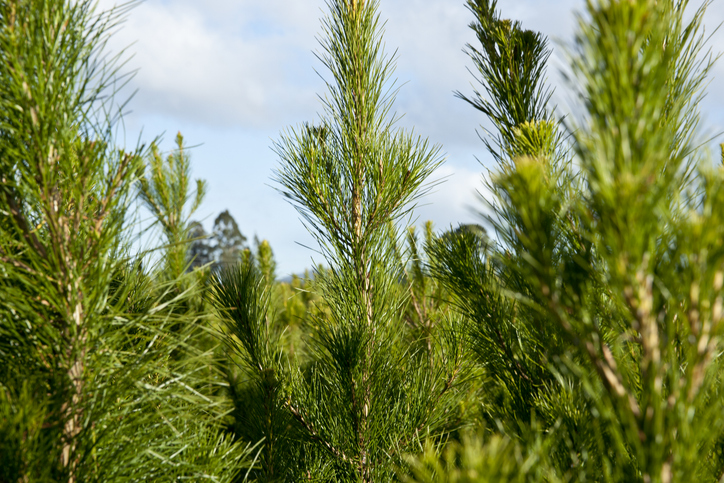
Find out how well radiata pine could grow and yield timber on your whenua.
See how susceptible your soil and climate are to nitrogen loss each month.
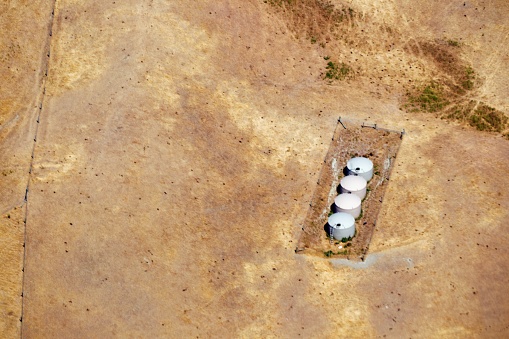
Explore drought impacts and find adaptation strategies for a changing climate.
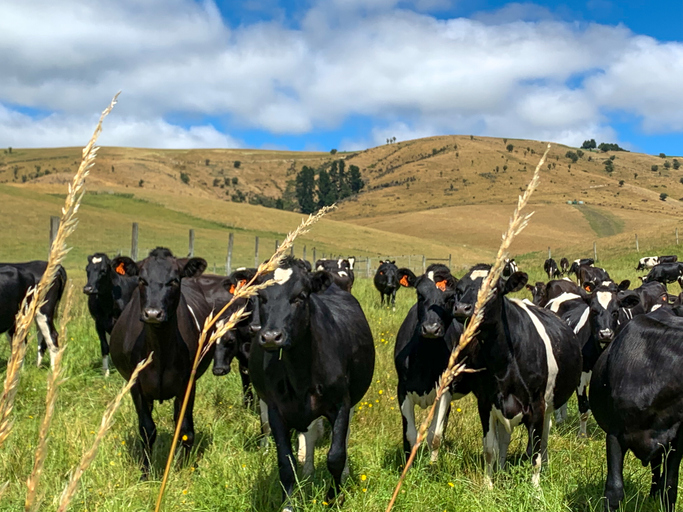
See how many hot days dairy cows in your rohe could face as the climate warms.
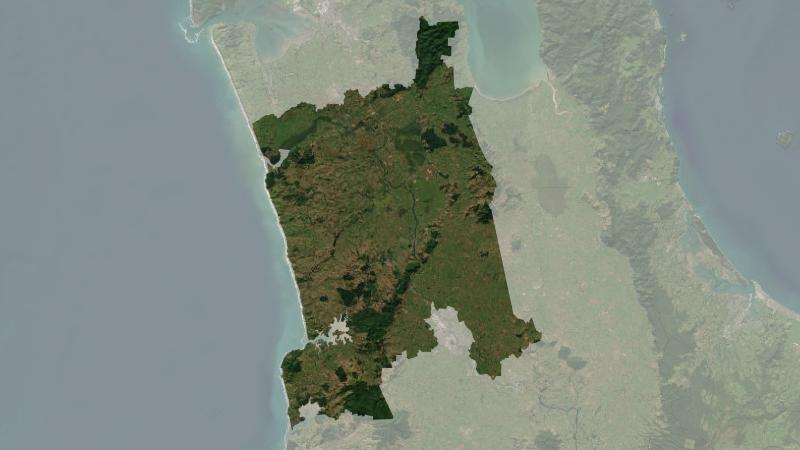
Understand climate event and variability trends for Waikato District.
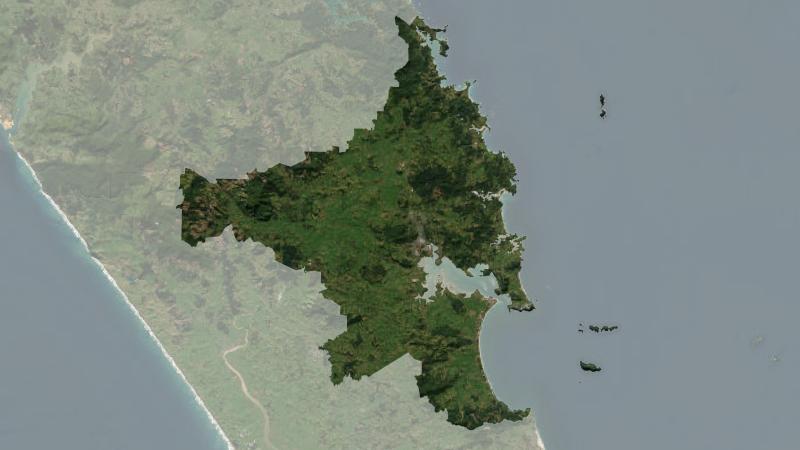
Understand climate event and variability trends for Whangarei District.
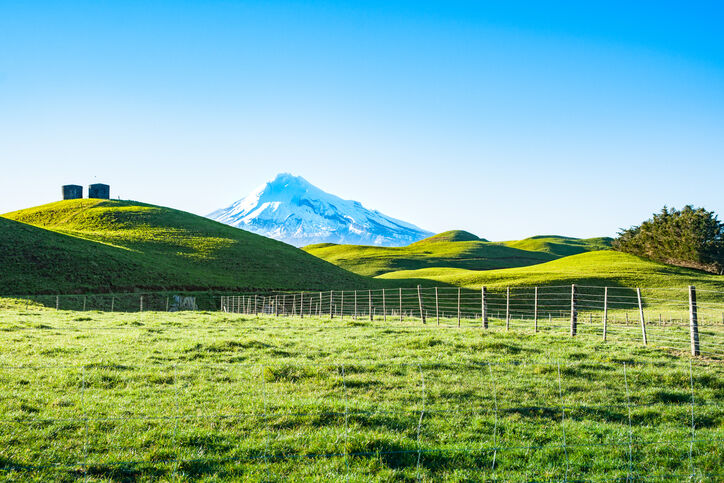
A report produced by NIWA, details climate change impacts and projections for Taranaki until 2100.
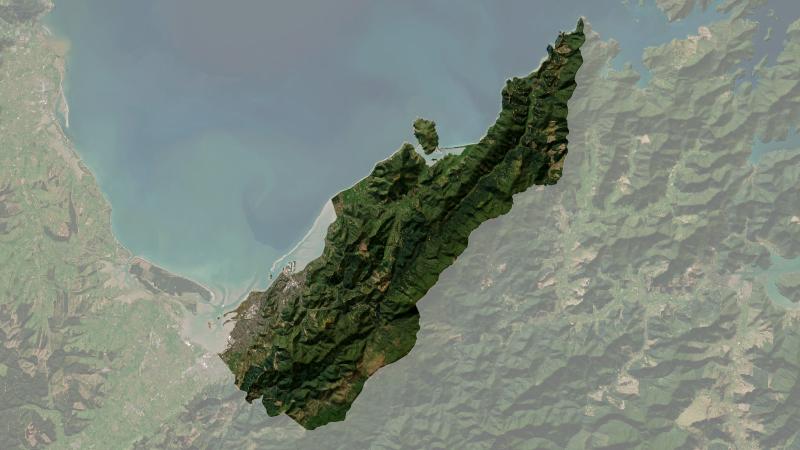
Understand climate event and variability trends for Nelson.
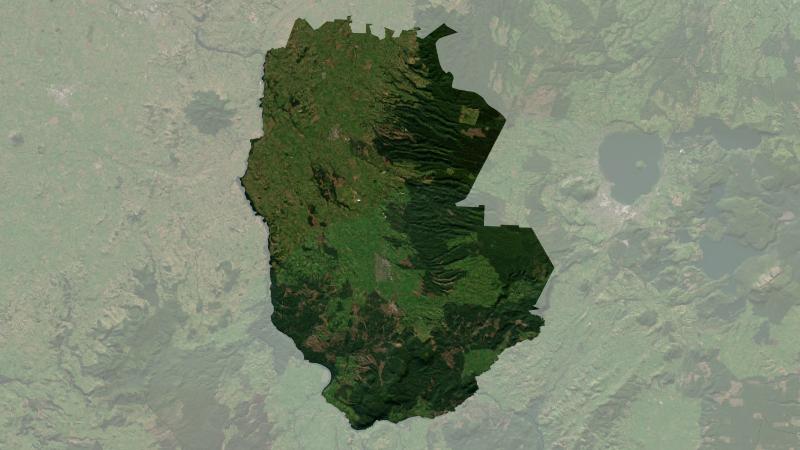
Understand climate event and variability trends for South Waikato District.
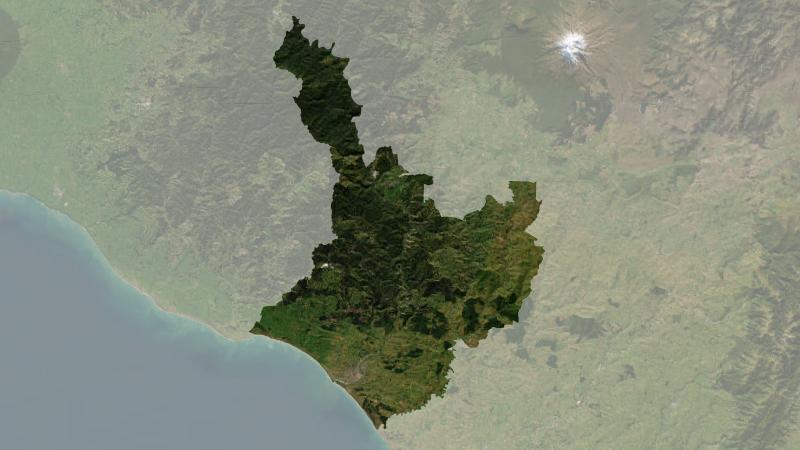
Understand climate event and variability trends for Whanganui District.
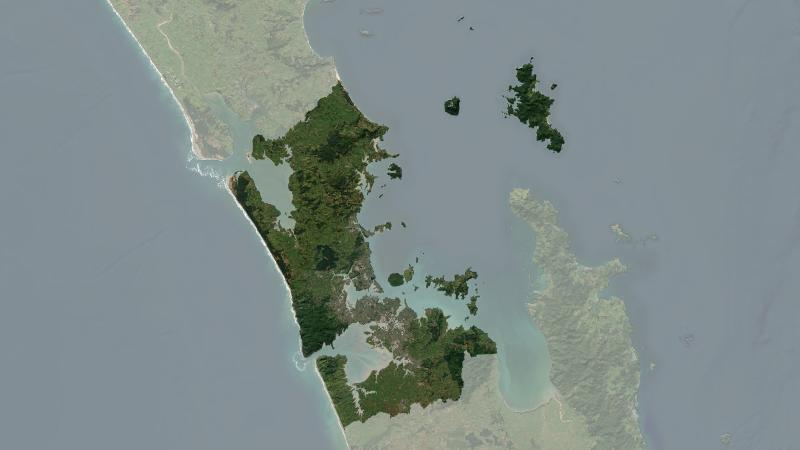
Understand climate event and variability trends for Auckland.
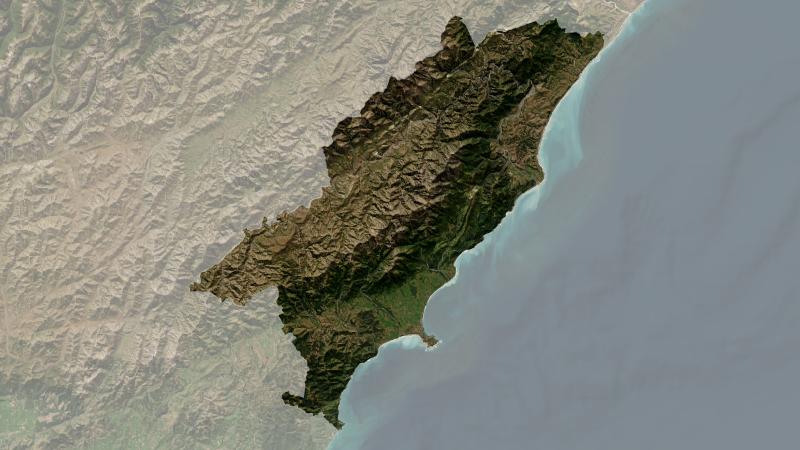
Understand climate event and variability trends for Kaikōura District.
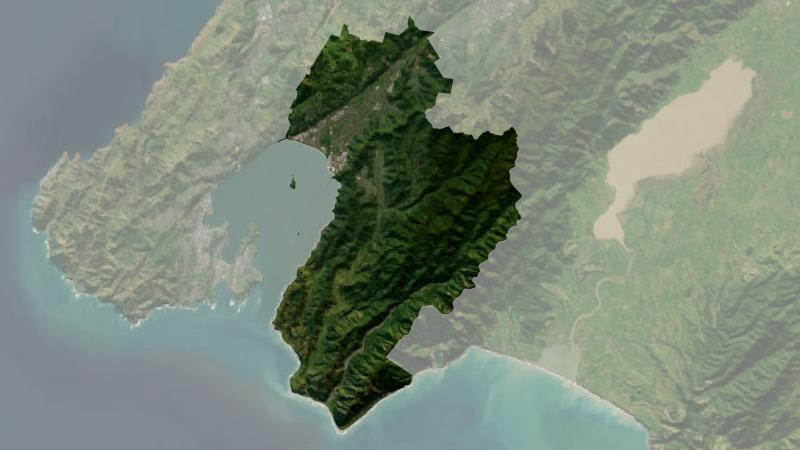
Understand climate event and variability trends for Lower Hutt.
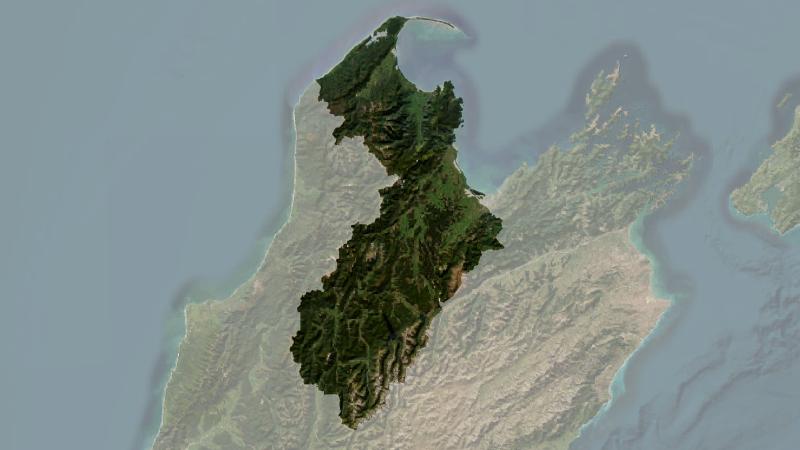
Understand climate event and variability trends for Tasman District.