Drought indicator charts
Climate
Risk
Water
View drought intensity data and charts for your region. Updated monthly.
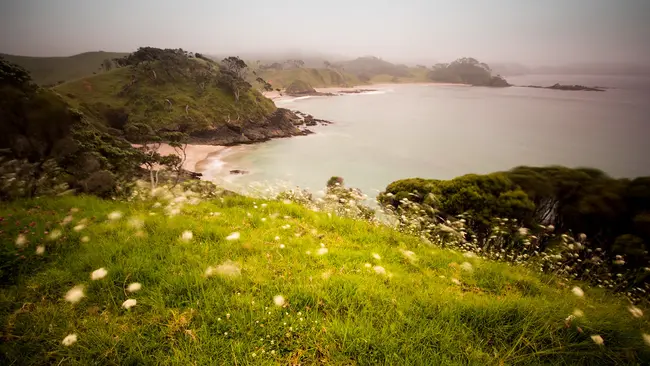
Northland rainfall maps show how much rain falls in the region each month. They are based on readings from around 40 automatic rain gauges. These gauges are used by local councils and weather services.
The maps show rainfall as a percentage of what is normally expected for that time of year. This can help you understand how much rain your whenua us getting compared to usual amounts. The data can help in planning for crops, managing water resources, and preparing for dry or wet conditions.
Maps are updated monthly, giving a clear overview of seasonal rainfall trends.
Photo: "Elliot Bay" by Alex Schwab is licensed under CC BY-ND 2.0.
View drought intensity data and charts for your region. Updated monthly.
The SPI measures drought and wet conditions using recent rainfall data.
View maps showing average soil moisture deficit onset and termination dates across New Zealand.
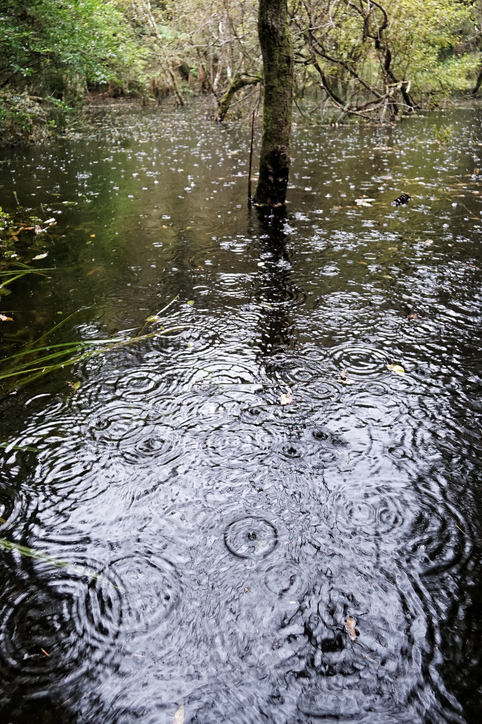
See how drought conditions and extreme rainfall in Aotearoa have changed as a result of climate change.
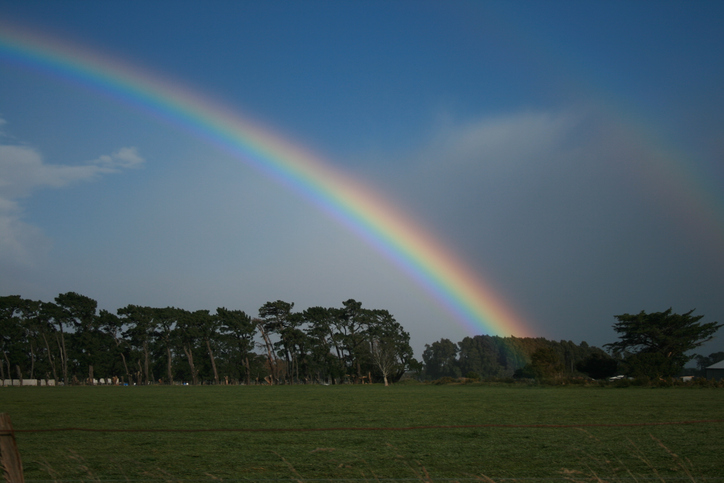
See how recent rainfall in your rohe compares to historic records - a useful indicator for drought planning.
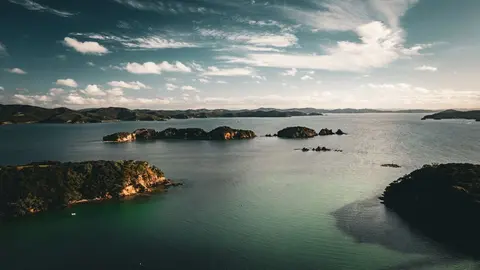
Find out what Northland's mild, humid and windy climate means for your whenua.
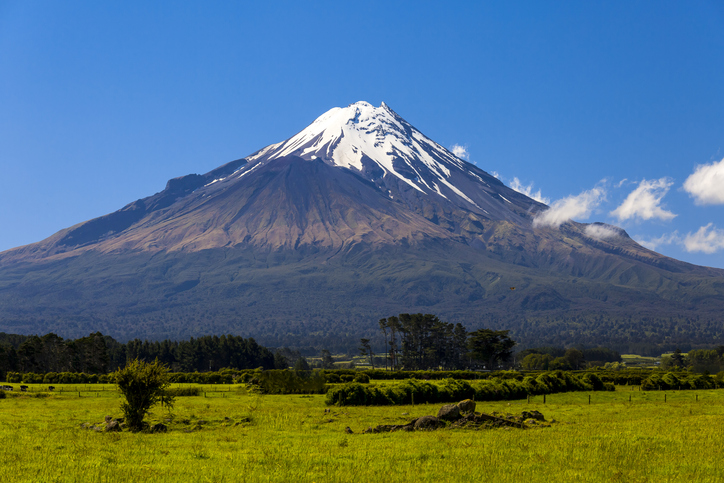
Access monthly and yearly climate summaries for Taranaki from the regional council.
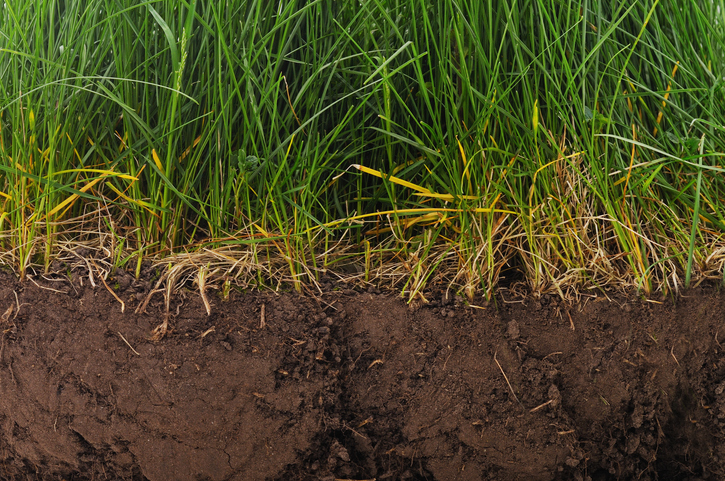
Find factsheets about how to manage different Northland soils.
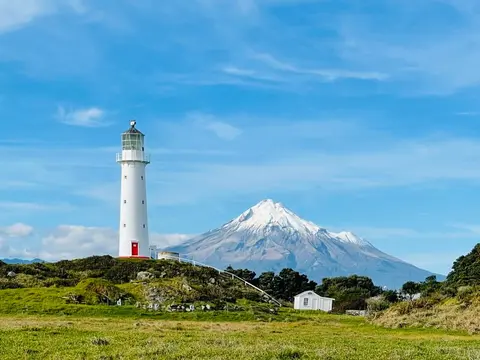
Check live rainfall, river level and water quality readings across Taranaki.
See how susceptible your soil and climate are to nitrogen loss each month.
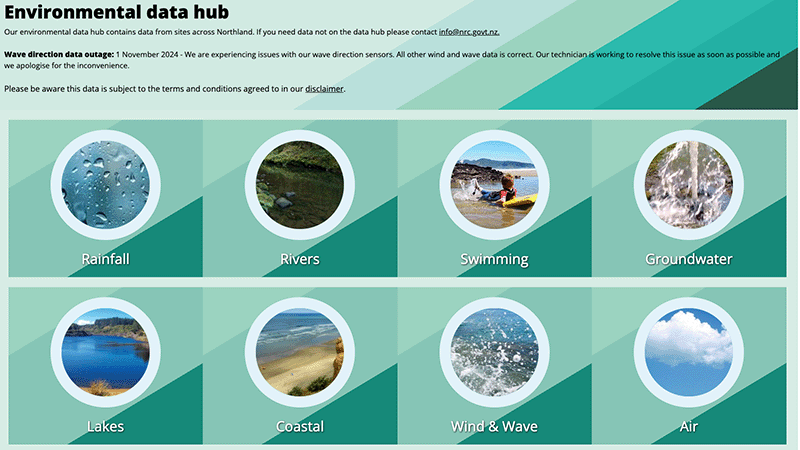
Access diverse environmental data from Northland, including air, water, and rainfall quality.
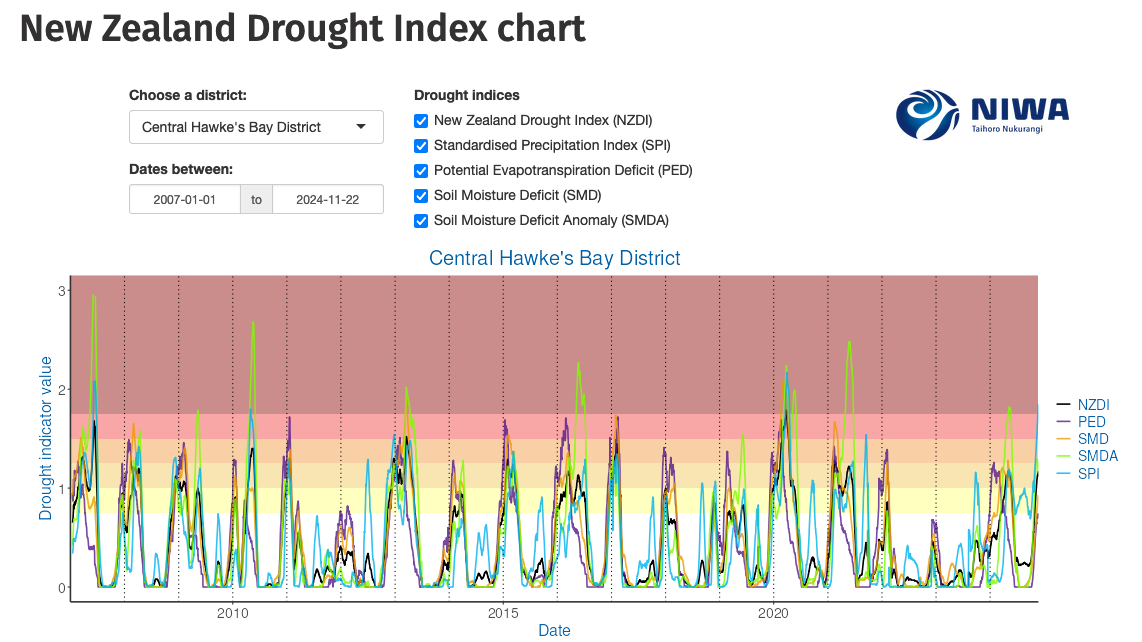
Monitor drought in New Zealand using key indicators and climate data. Access maps and downloads.
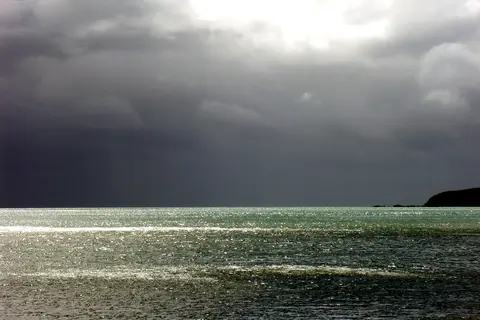
Compare rainfall, frost and dry-spell patterns across Te Matau-a-Māui Hawke's Bay.
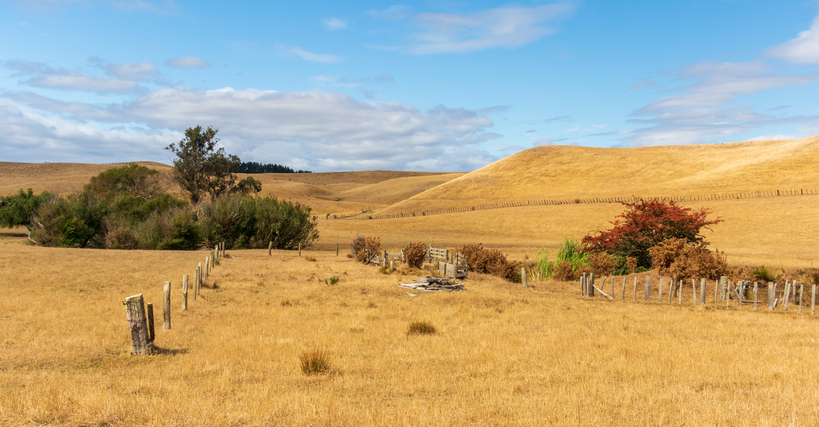
The NIWA Drought Forecasting Dashboard helps farmers track drought risk and rainfall for the next 35 days for better planning and decision-making.
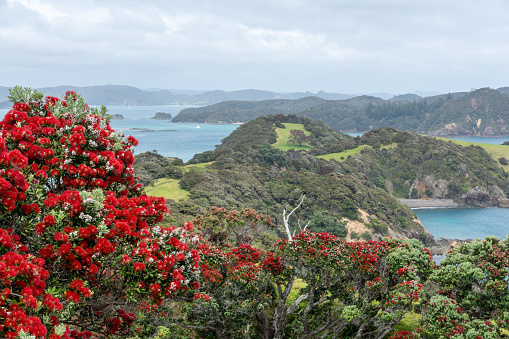
Explore projected temperature and rainfall changes for Aotearoa online.
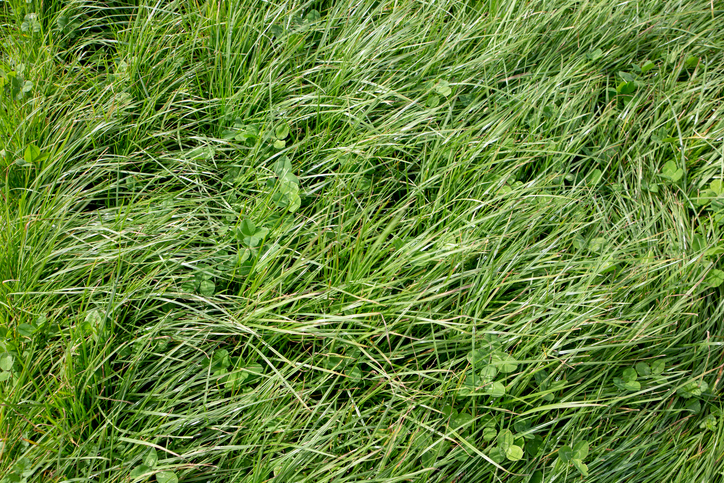
Find out how much drier your pasture could get by 2050 as the climate changes.
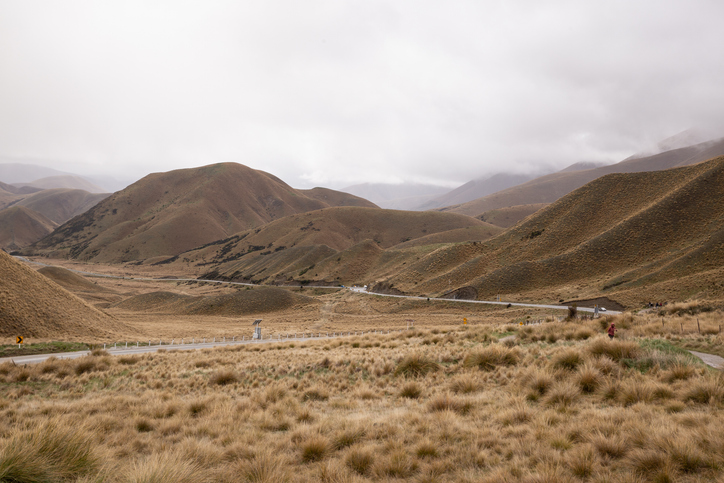
Find out how pasture growth on your land could change as the climate warms.
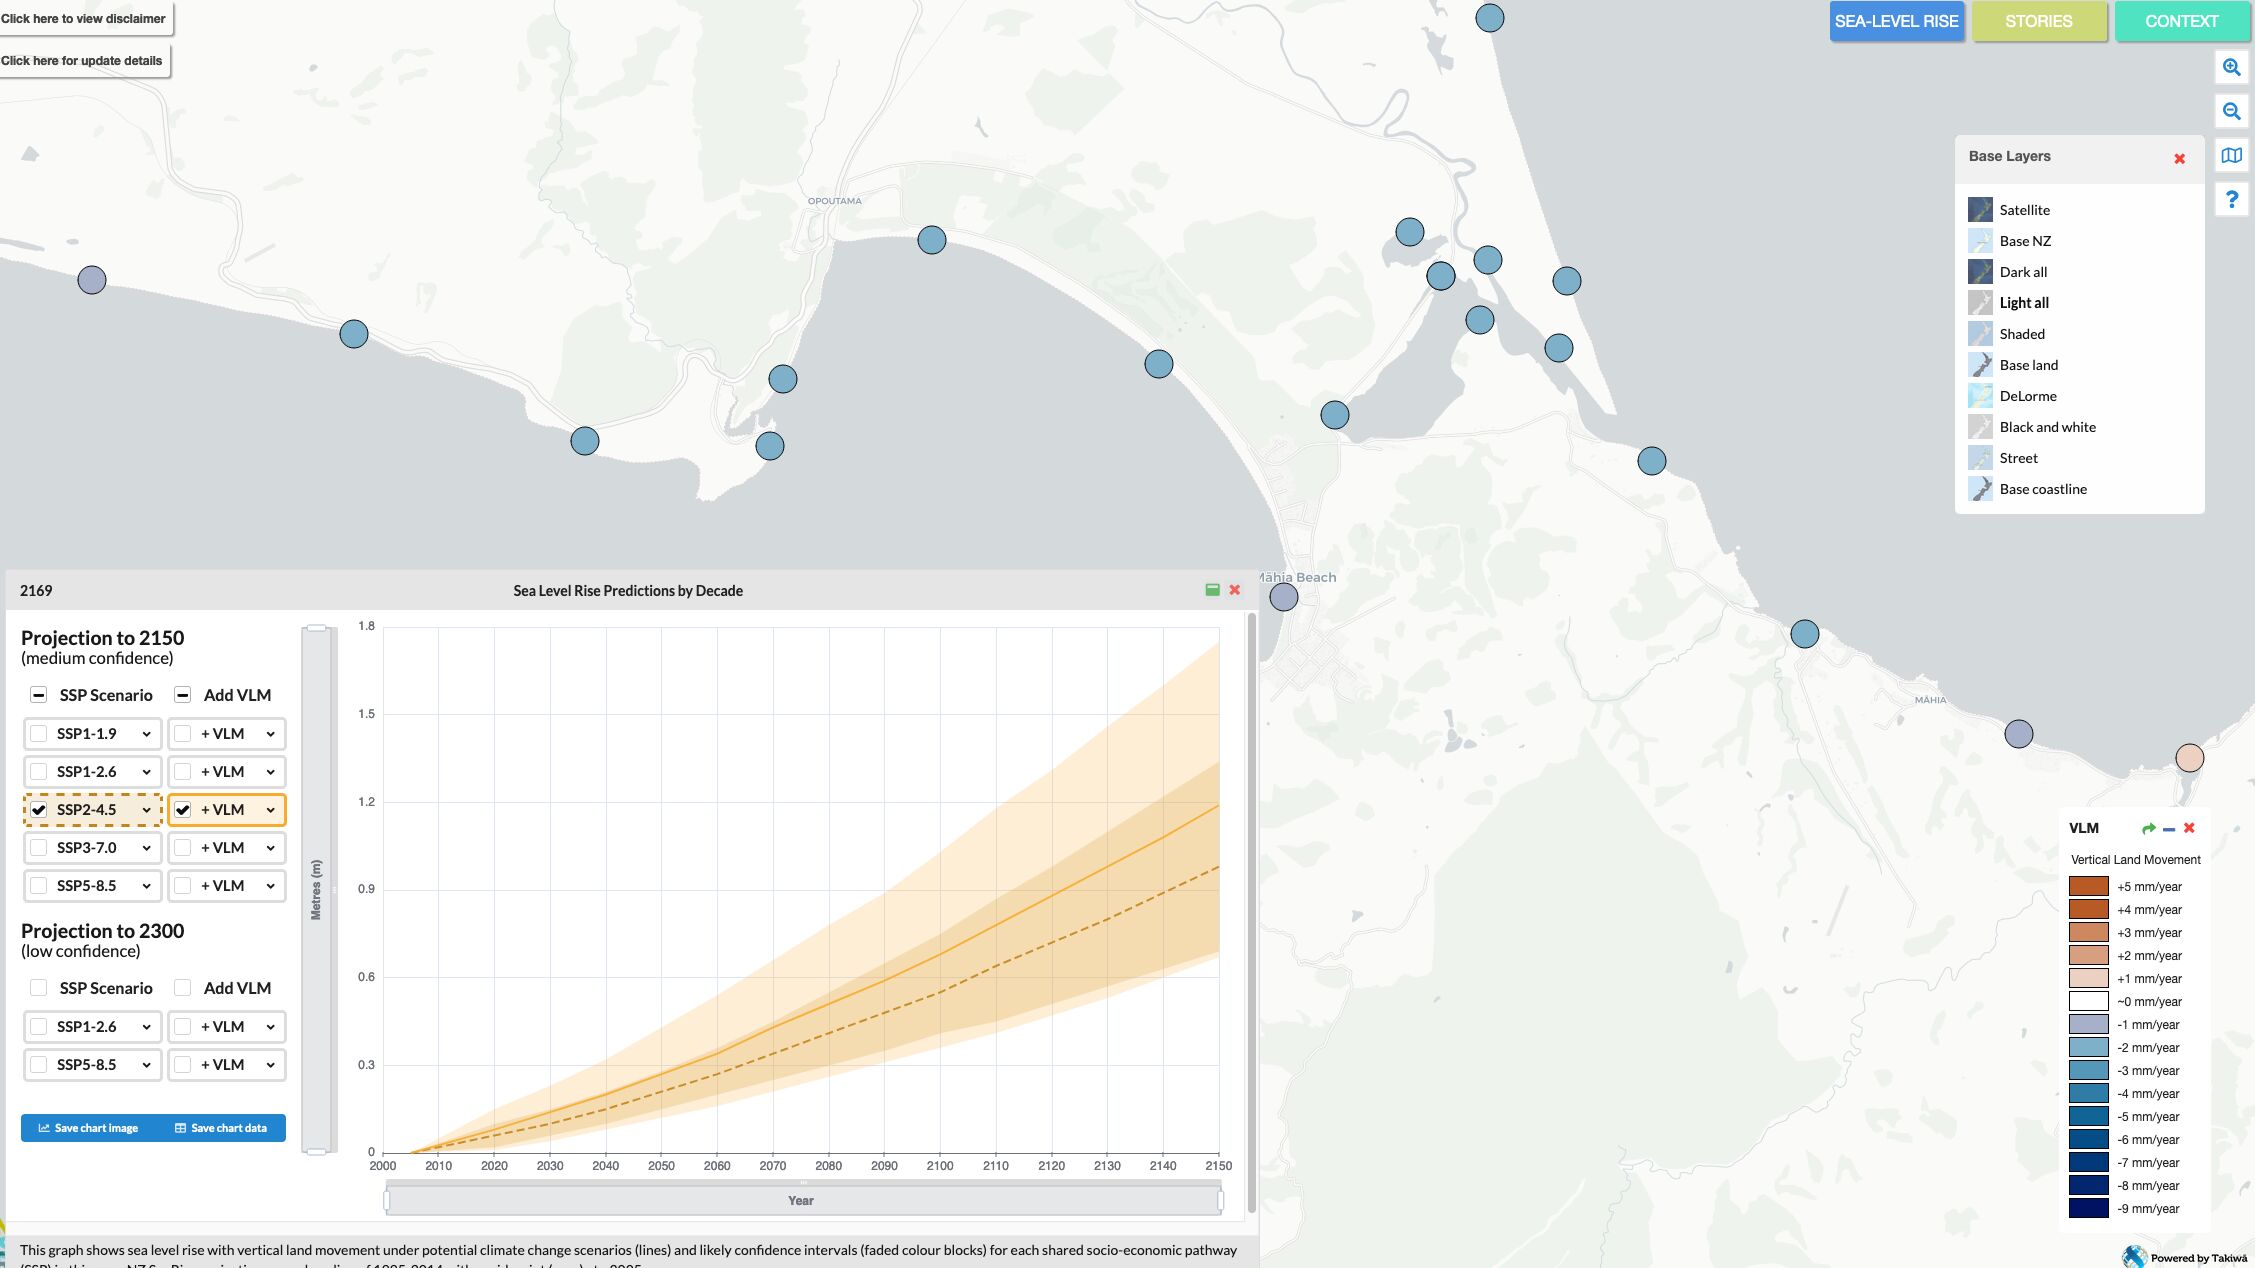
Explore sea-level rise projections for New Zealand’s coasts, with local impacts and maps available.
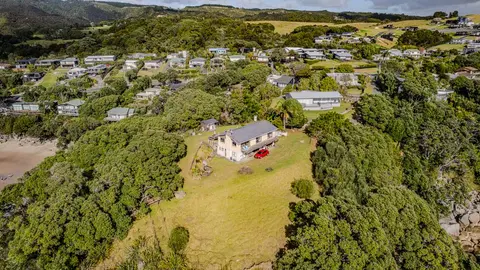
Check how coastal flooding, erosion and river flooding could affect your own property.
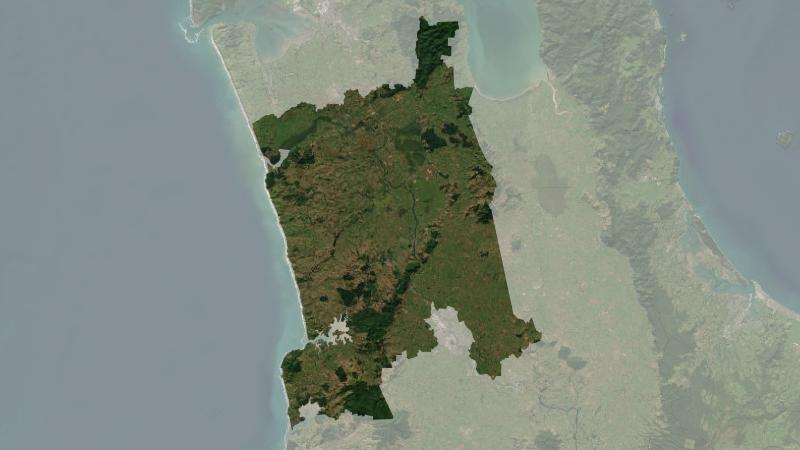
Understand climate event and variability trends for Waikato District.
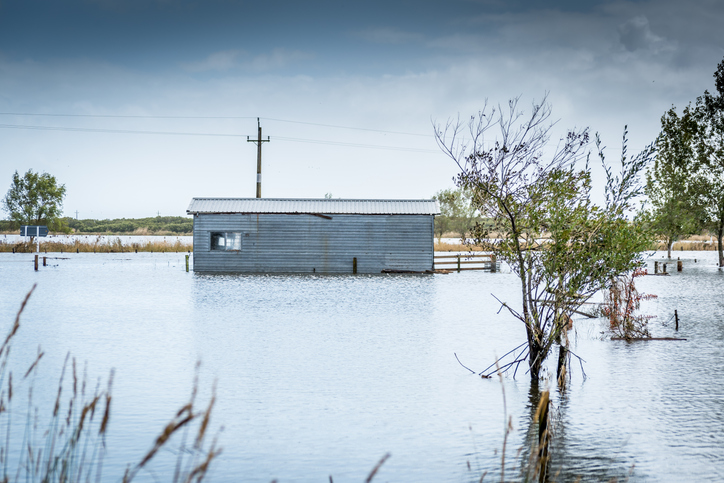
Explore coastal flood maps to assess the potential impacts of sea-level rise in your rohe.
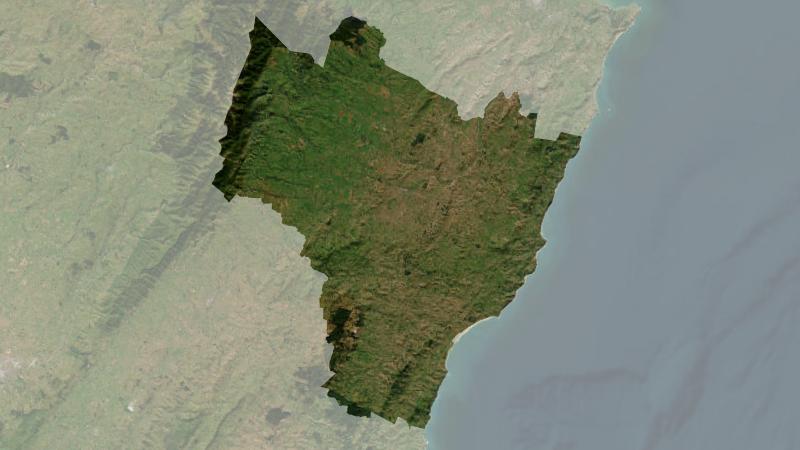
Understand climate event and variability trends for Central Hawke's Bay District.