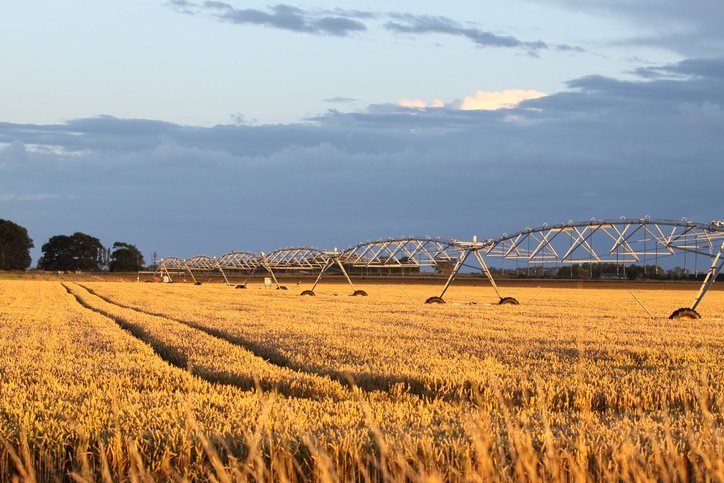
Soil Moisture Deficit (SMD) map
Climate
Soil
Water
View soil moisture levels and drought indicators across the motu.
The Drought Indicator Charts show how drought intensity changes each year across New Zealand. They track potential evapotranspiration deficit, which helps farmers understand water needs for plant growth. Monthly updates provide current data for each region, helping to manage water resources effectively.
View soil moisture levels and drought indicators across the motu.
See how recent rainfall in your rohe compares to historic records - a useful indicator for drought planning.
This research analyses future drought risks due to climate change impacts.
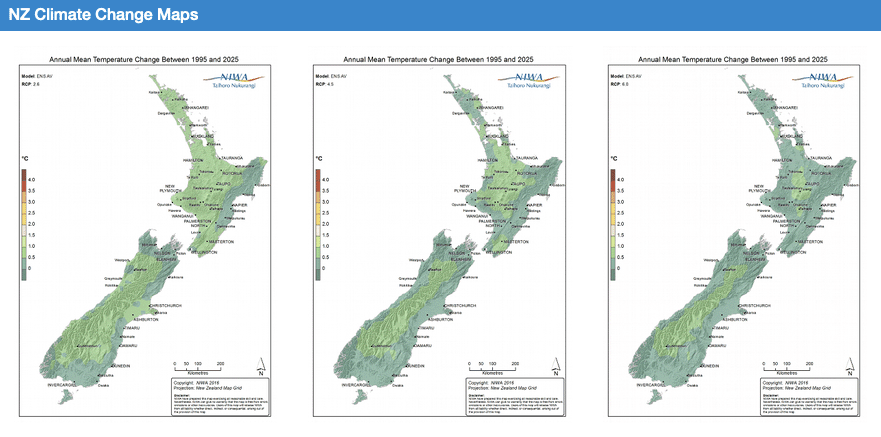
Explore how climate change will impact New Zealand's weather and environment over the coming century.
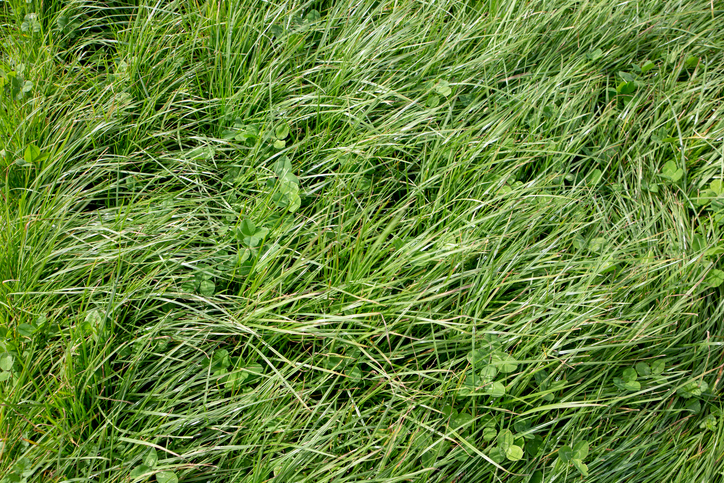
Find out how much drier your pasture could get by 2050 as the climate changes.
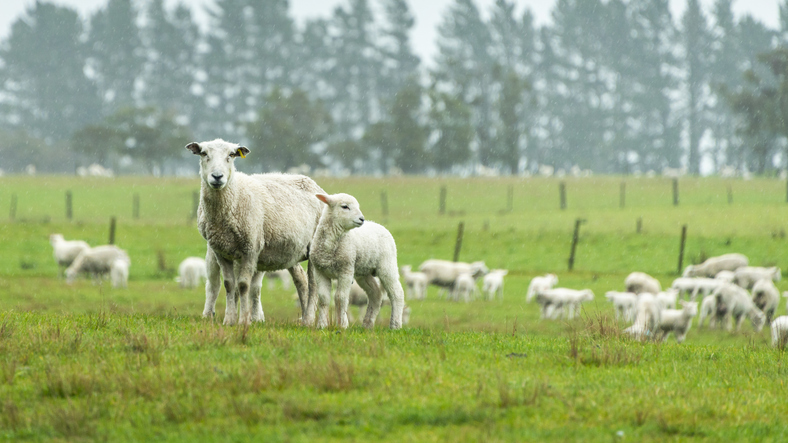
The SPI measures drought and wet conditions using recent rainfall data.

View rainfall data for Northland, showing monthly averages and percentages from gauges.
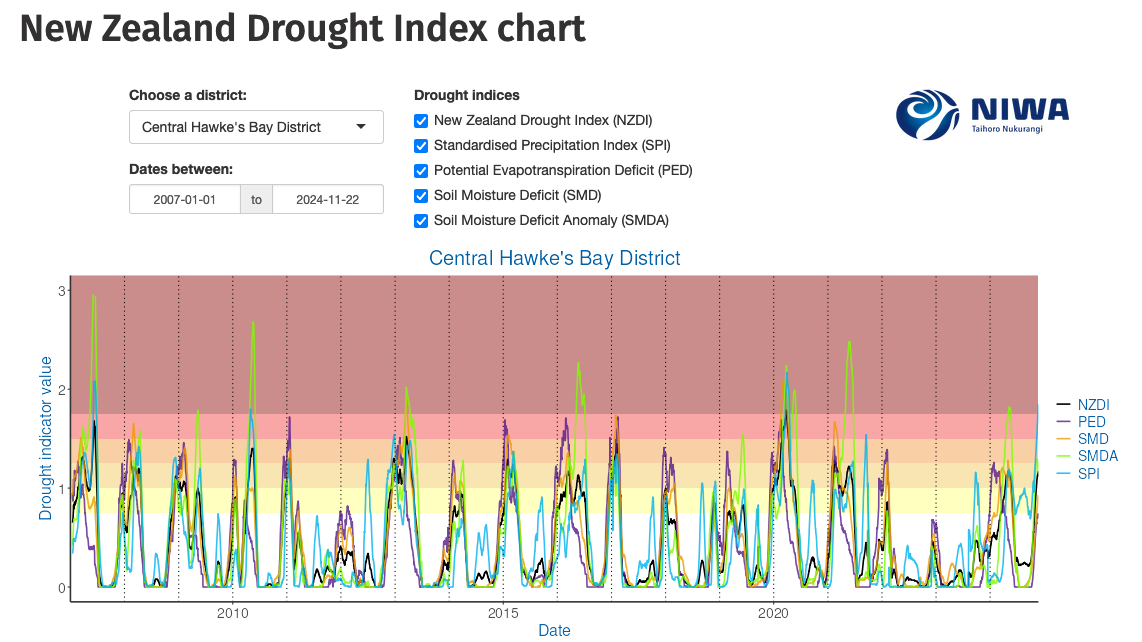
Monitor drought in New Zealand using key indicators and climate data. Access maps and downloads.
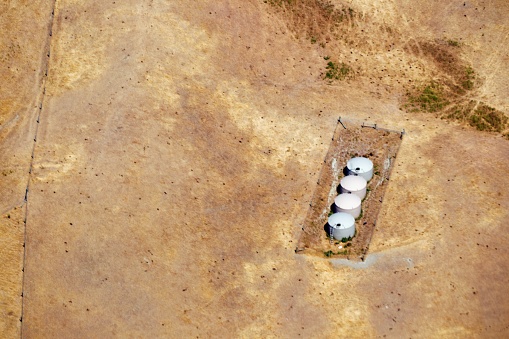
Explore drought impacts and find adaptation strategies for a changing climate.
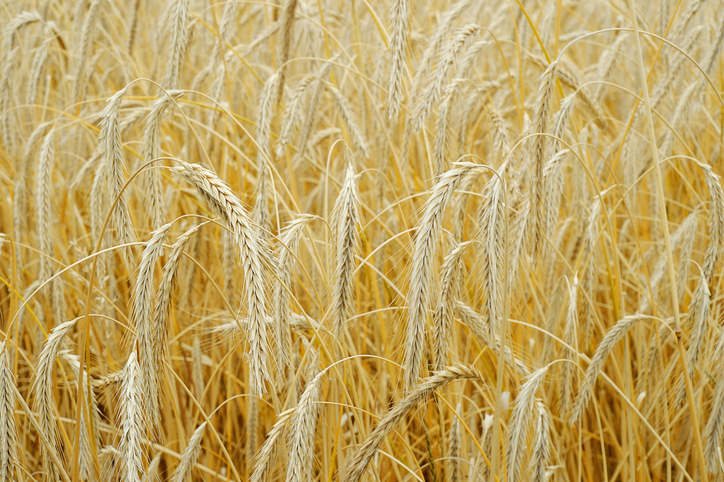
Find out how many jobs wheat could support on the whenua in your rohe.
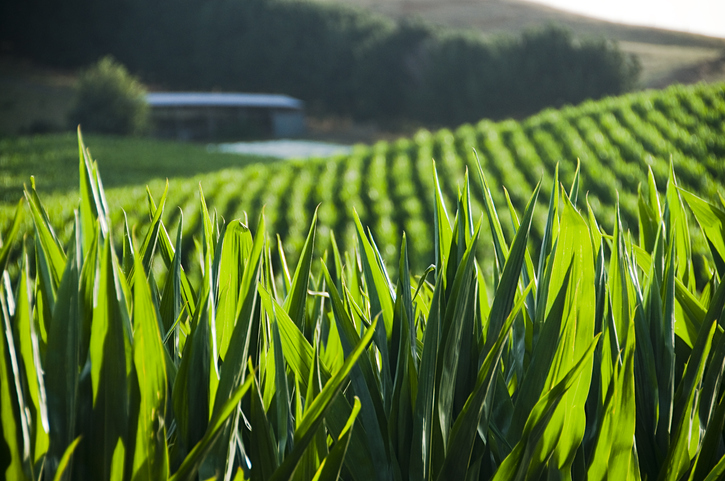
Explore how many jobs grain maize could support on the whenua in your rohe.
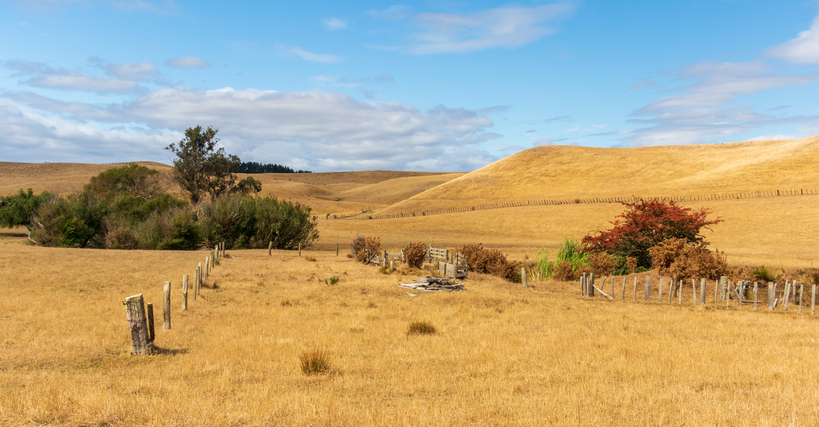
The NIWA Drought Forecasting Dashboard helps farmers track drought risk and rainfall for the next 35 days for better planning and decision-making.
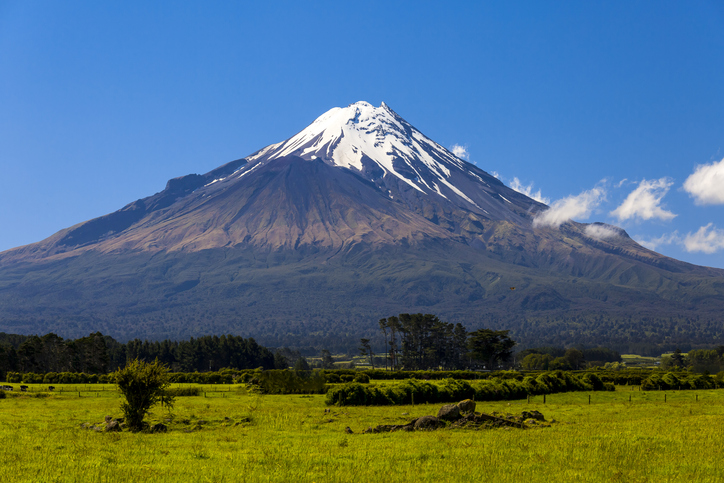
Access monthly and yearly climate summaries for Taranaki from the regional council.
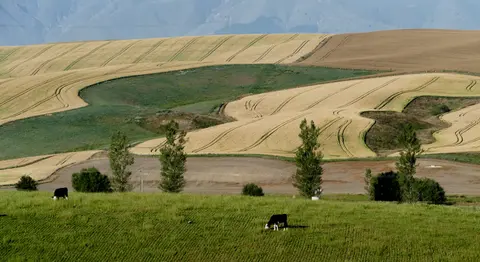
See how water shortfalls under maize could change as the climate warms.
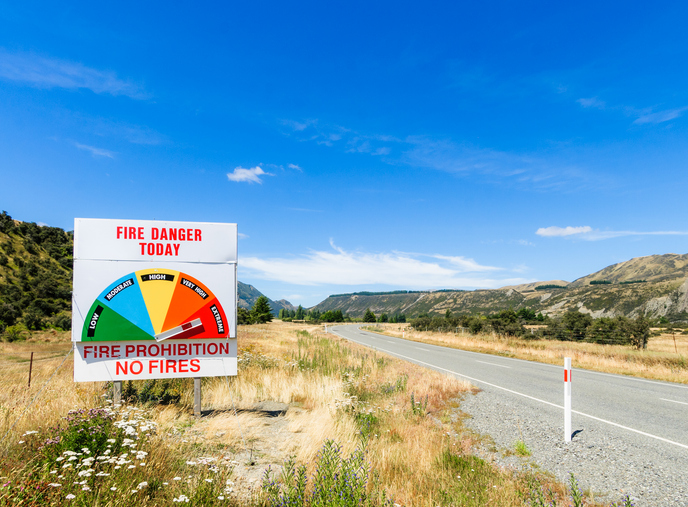
Learn about fire risks during droughts and how forestry insurance works in Aotearoa.
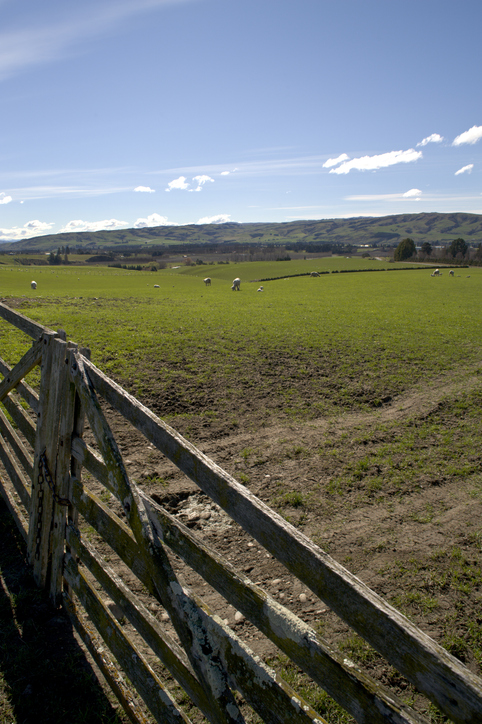
This report explores climate change impacts on New Zealand agriculture.
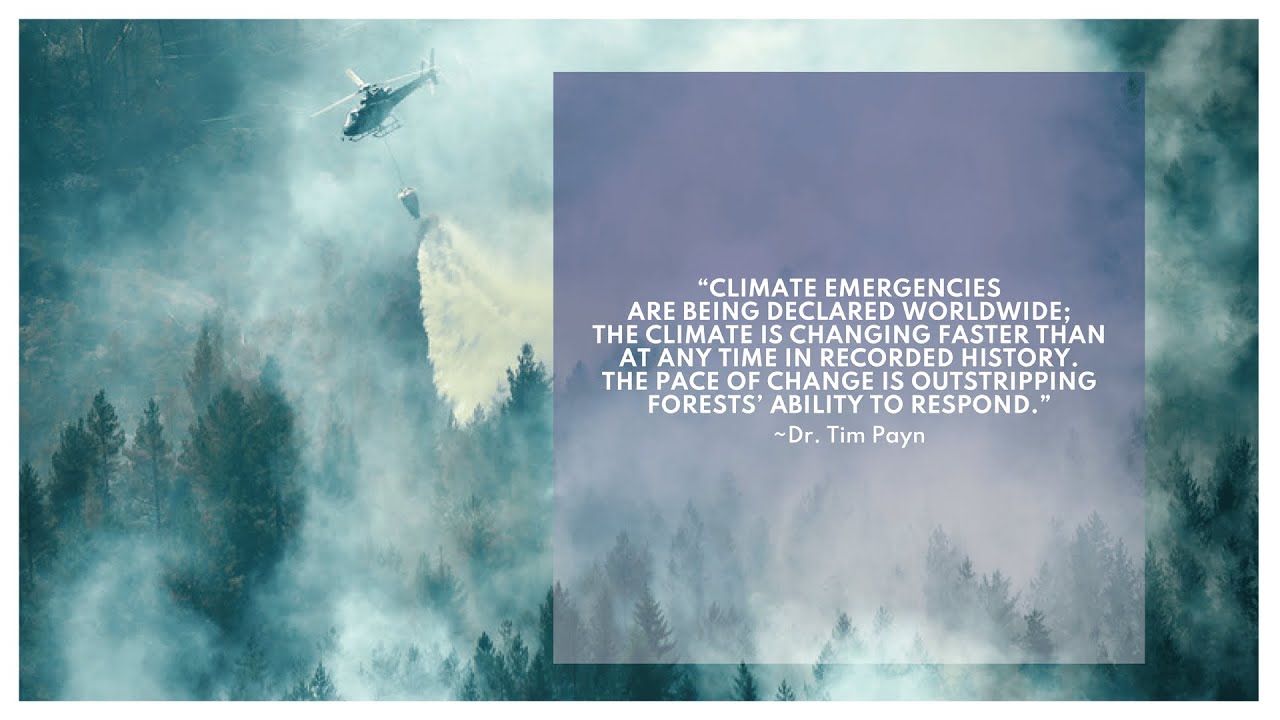
Hear about the effects of climate change on Aotearoa forests and learn strategies for resilience.
This research examines how climate change affects farmland values in Aotearoa.
This research explores the impacts of drought and climate change on farm profitability.
AgriZero NZ shares updates on investments in methane-reducing innovations for farming.

Read NIWA's full technical report on Northland's climate out to 2090.
A report produced by NIWA, details climate change impacts and projections for Taranaki until 2100.
Dairy farmers in Waikato adapt to floods, droughts, and climate change impacts.