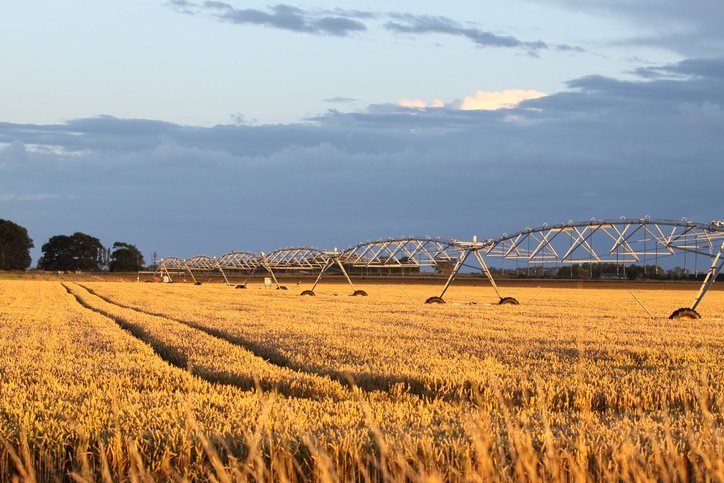
Soil Moisture Deficit (SMD) map
Climate
Soil
Water
View soil moisture levels and drought indicators across the motu.
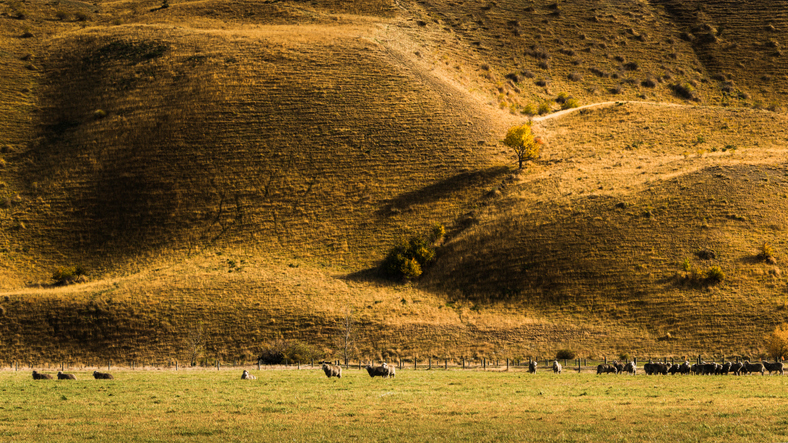
Explore average soil moisture deficit maps showing the first and last dates of soil moisture deficit across New Zealand. These maps help identify typical moisture deficit seasons, allowing for year-to-year comparisons. Use them to understand when soil moisture may be low for better planning and management.
View soil moisture levels and drought indicators across the motu.
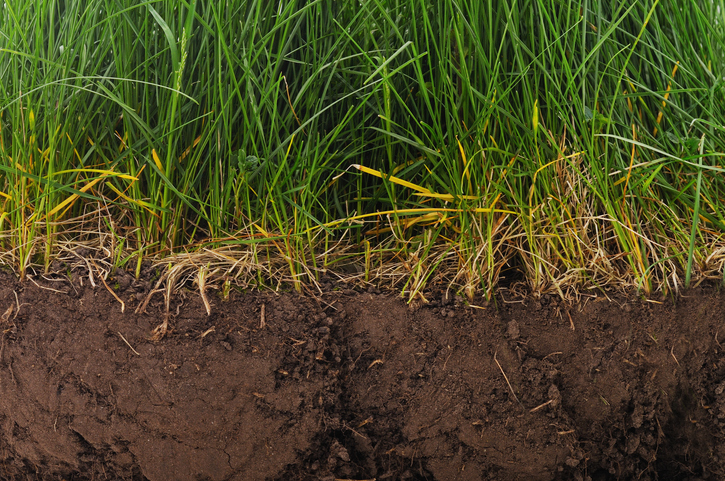
Find factsheets about how to manage different Northland soils.
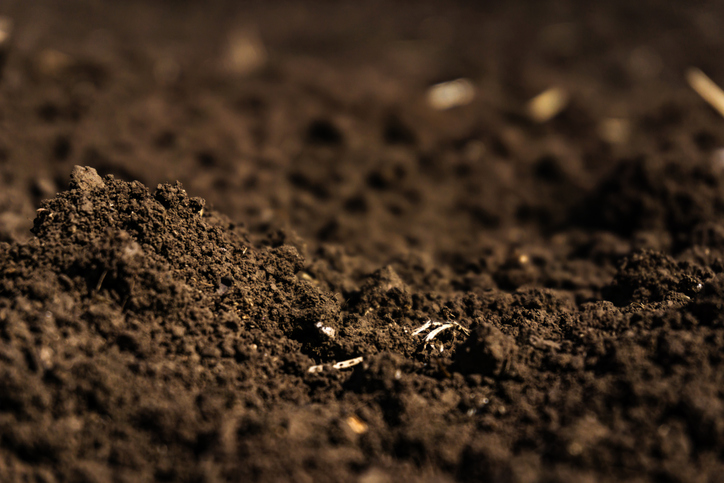
Learn how soil carbon impacts climate change and things you can do on your farm to offset your emissions.
View drought intensity data and charts for your region. Updated monthly.

View rainfall data for Northland, showing monthly averages and percentages from gauges.
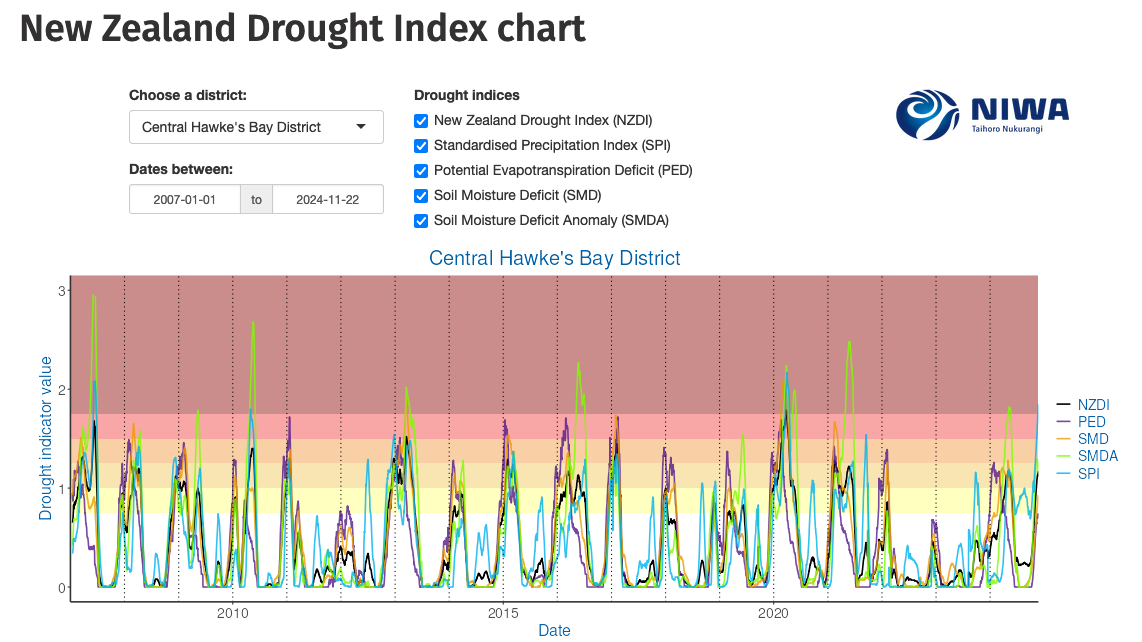
Monitor drought in New Zealand using key indicators and climate data. Access maps and downloads.
Find out how much drier your pasture could get by 2050 as the climate changes.
See how water shortfalls under maize could change as the climate warms.
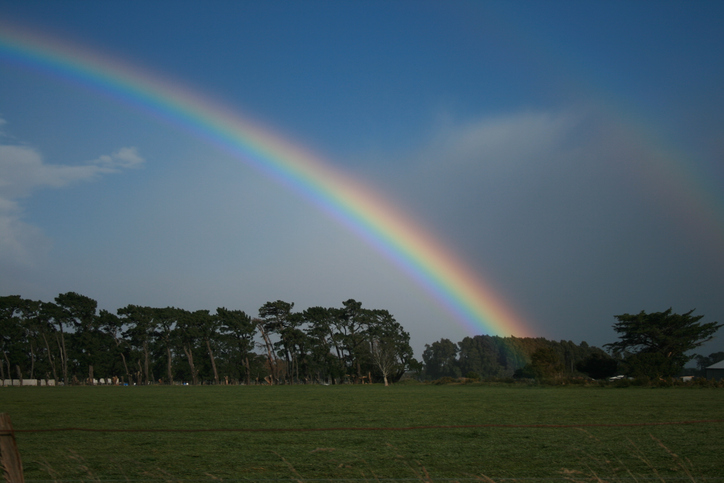
See how recent rainfall in your rohe compares to historic records - a useful indicator for drought planning.
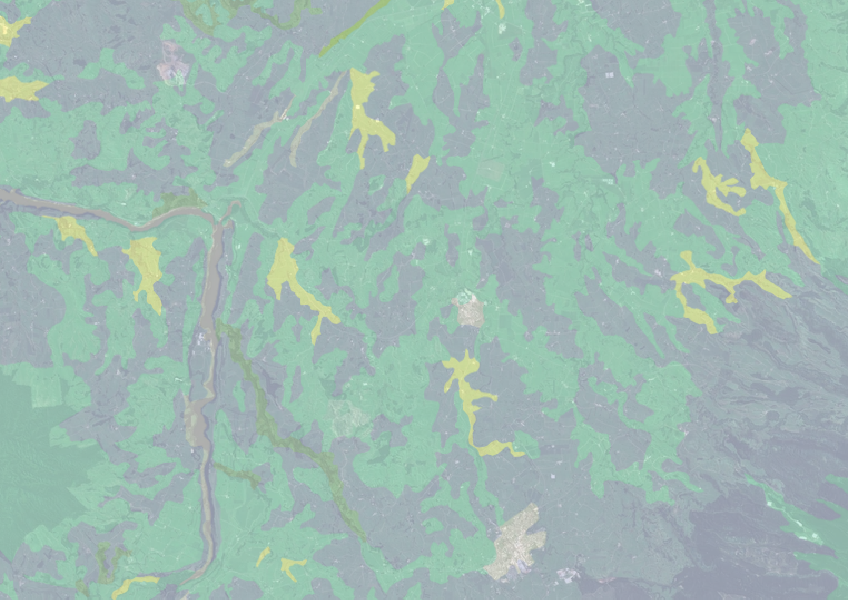
Find how deep you go before soil drainage slows across New Zealand.
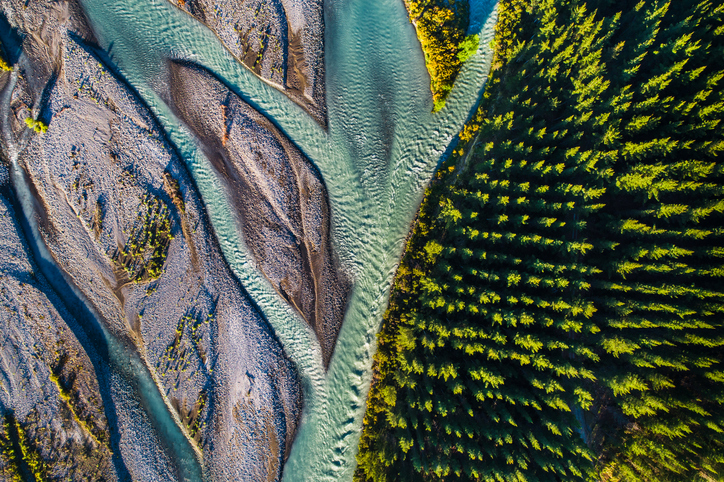
Learn how trees improve farming in East Otago and support timber production.
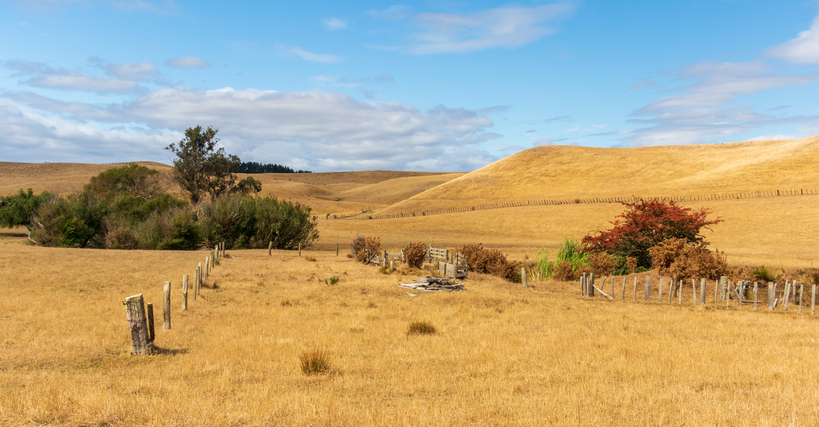
The NIWA Drought Forecasting Dashboard helps farmers track drought risk and rainfall for the next 35 days for better planning and decision-making.

Explore how much onions the whenua in your rohe could produce each year.
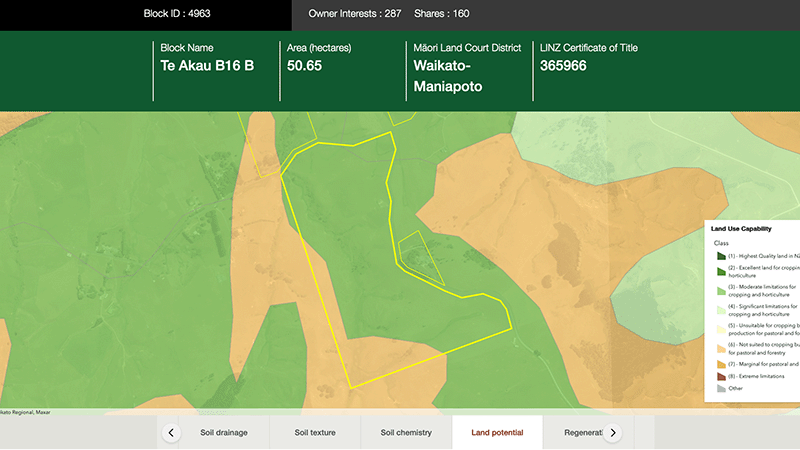
Explore different regulatory, soil, water, and land potential maps for your whenua.
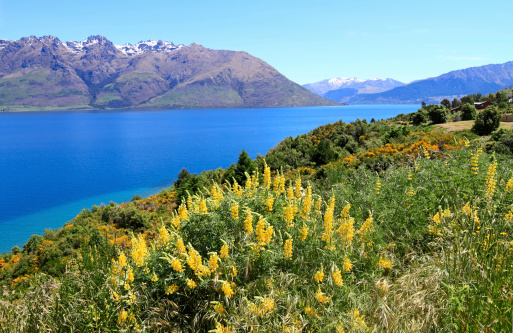
Annual climate summaries from NIWA provide key weather data and trends in New Zealand.
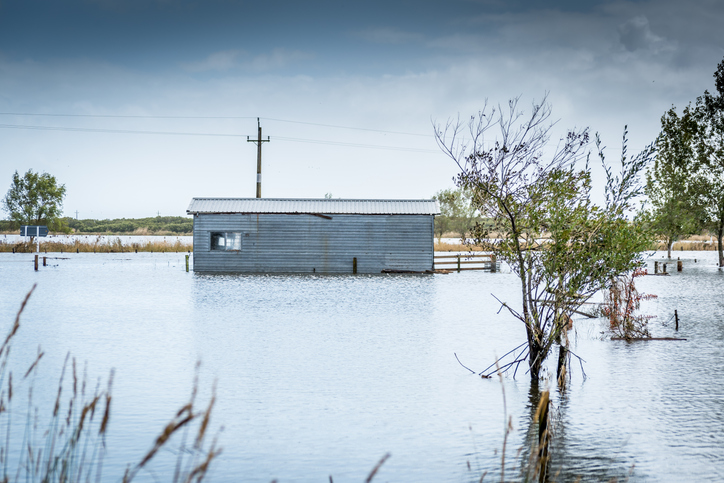
Explore coastal flood maps to assess the potential impacts of sea-level rise in your rohe.
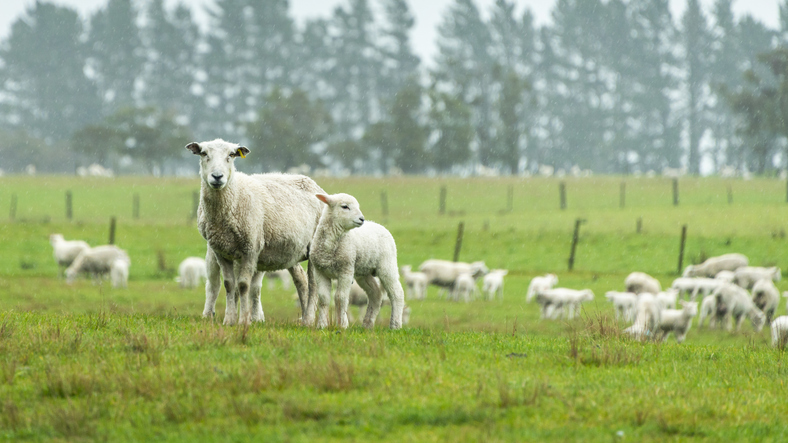
The SPI measures drought and wet conditions using recent rainfall data.
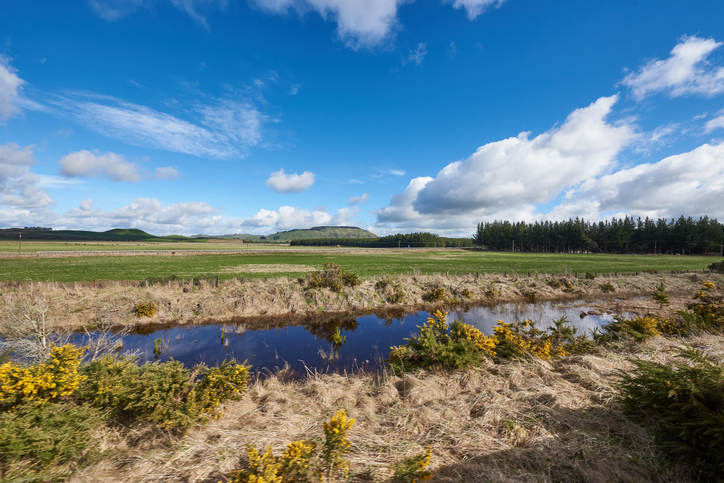
Explore maps showing how livestock density affects water quality in New Zealand rivers.
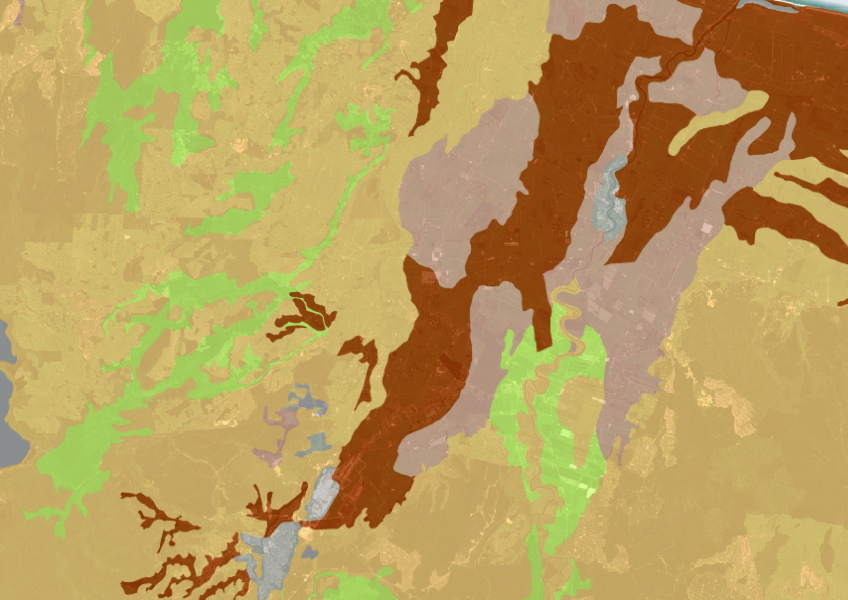
A dataset that estimates soil temperature across the motu.
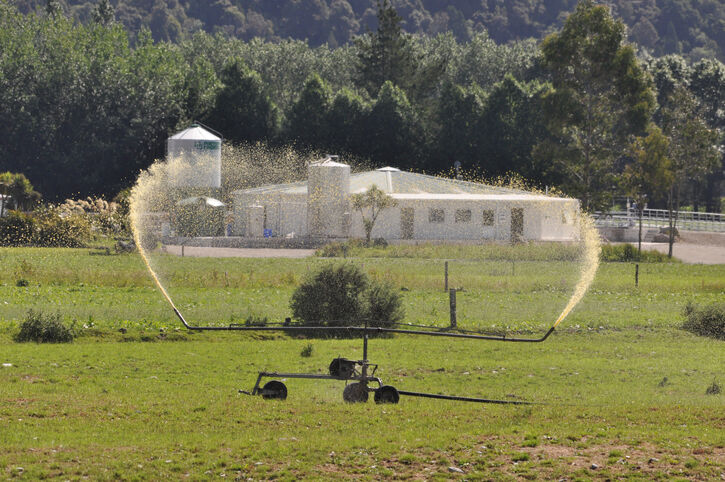
Access livestock manure data for N inputs and losses.
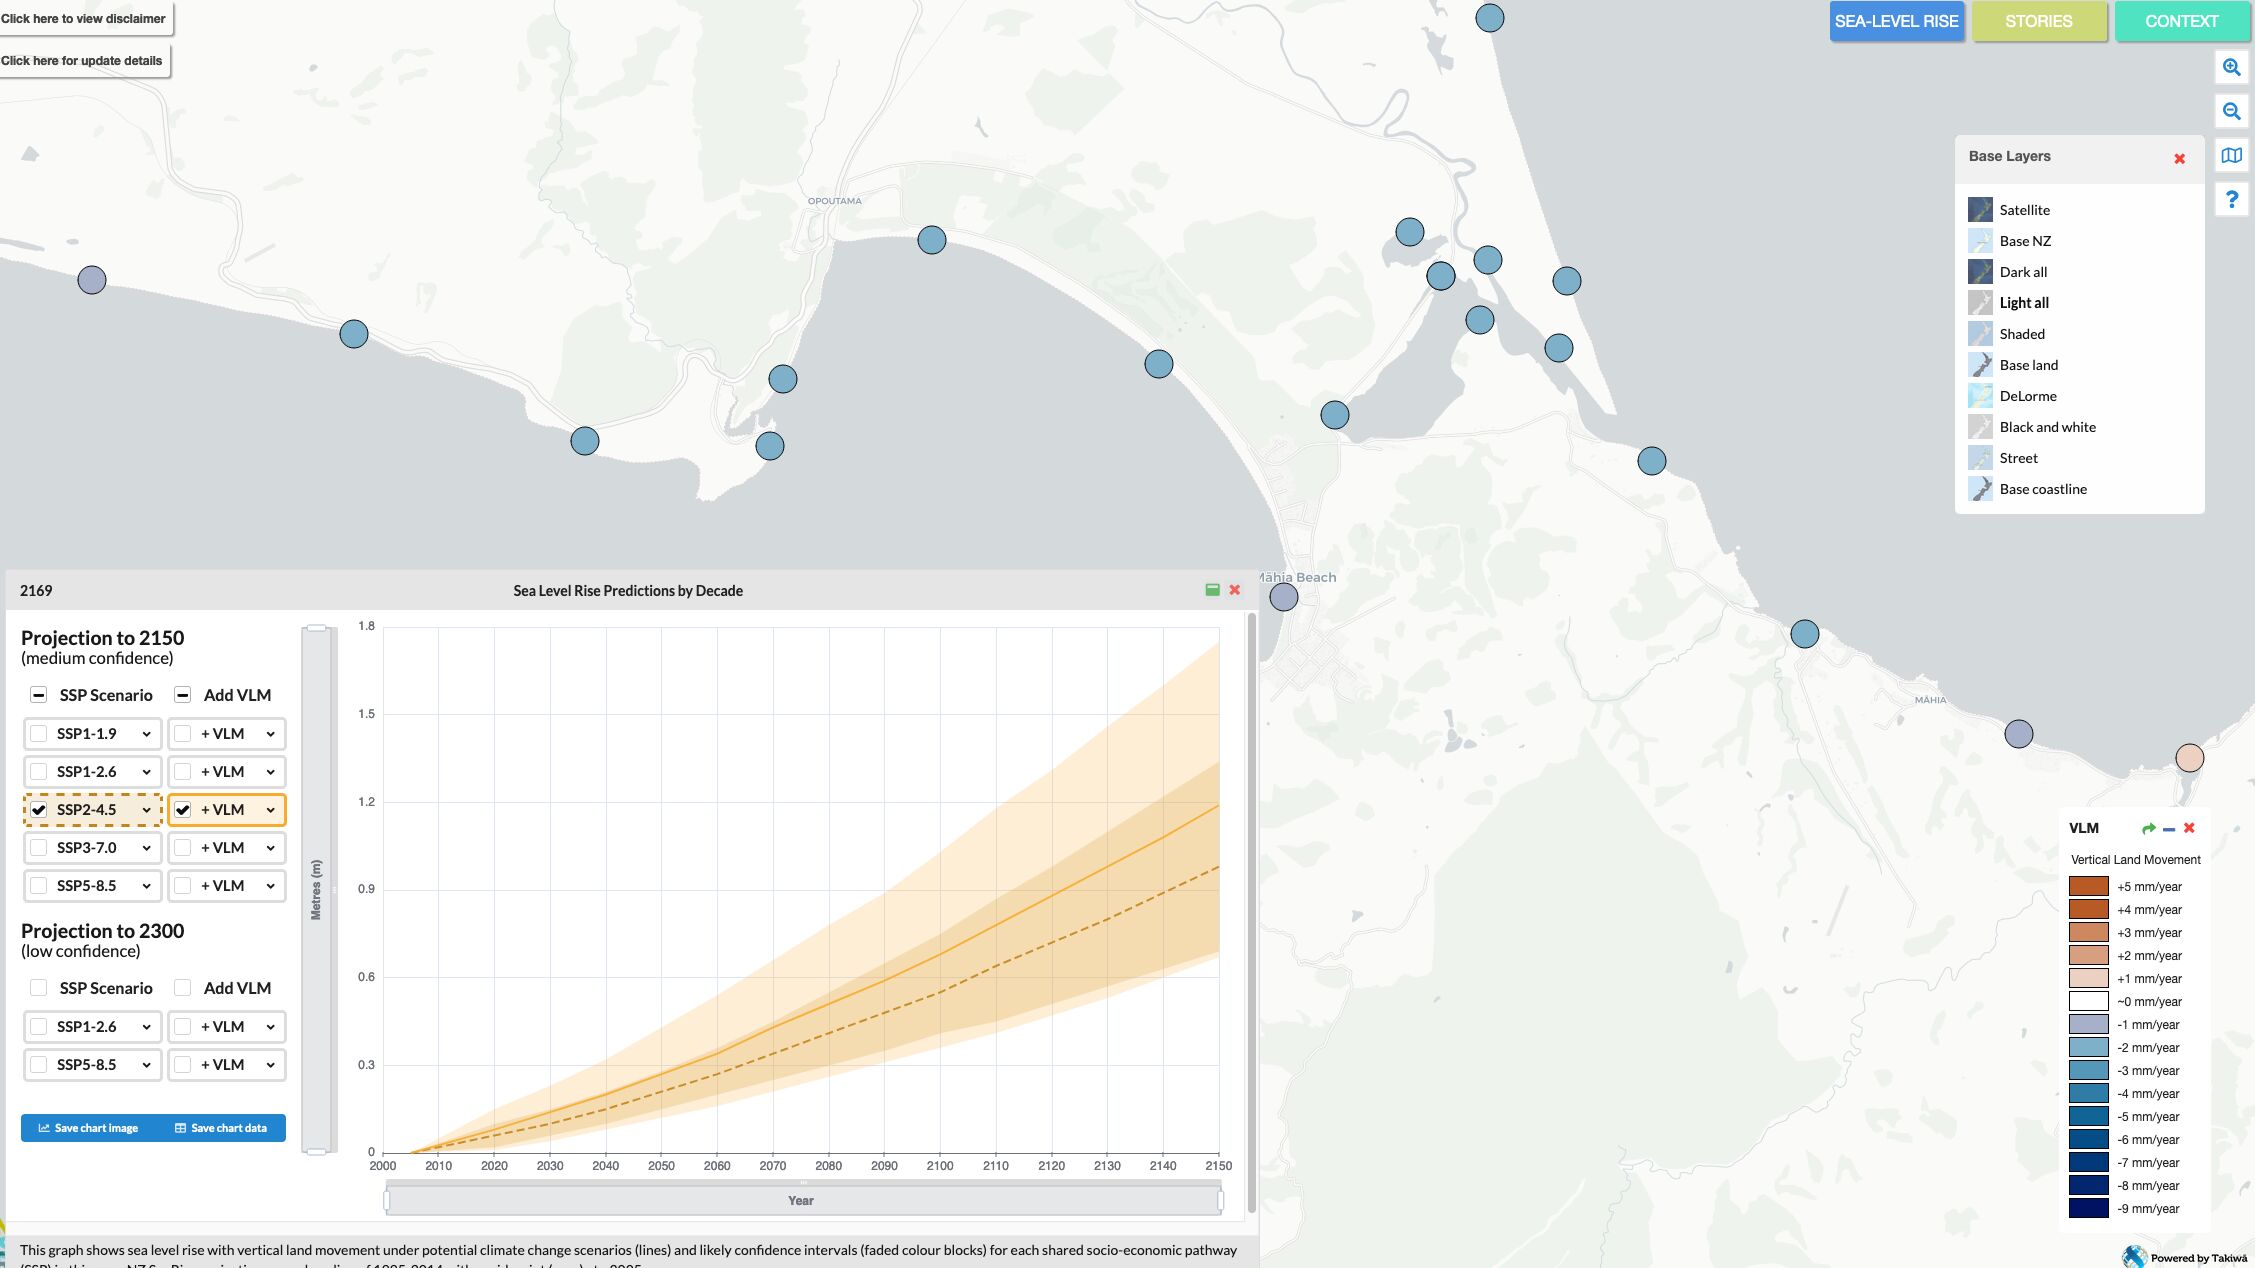
Explore sea-level rise projections for New Zealand’s coasts, with local impacts and maps available.
Learn how planting trees helps prevent soil erosion and improve water quality.
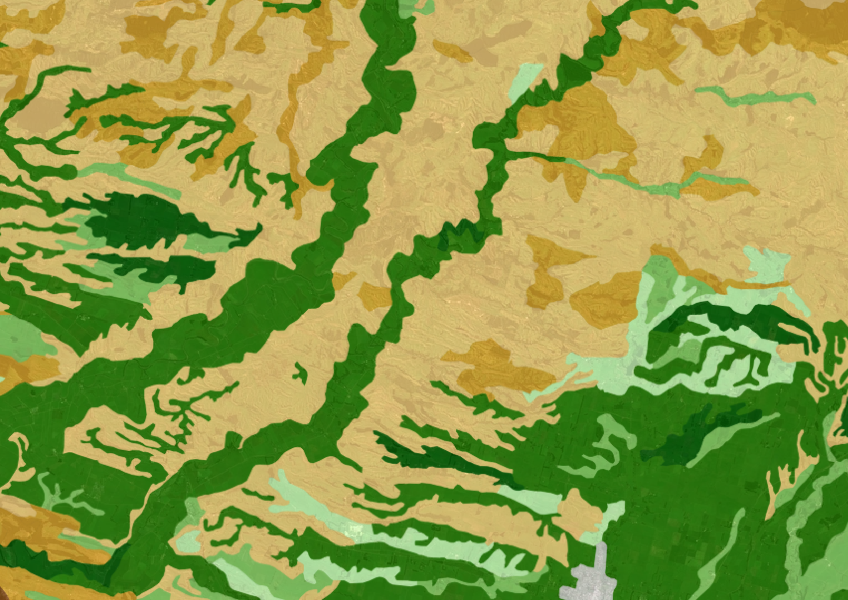
This widely used map estimates the land's potential for agricultural production.