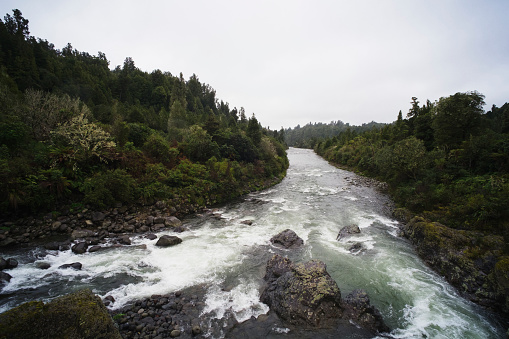
Current state vs freshwater objectives: Nutrients [Nitrogen and Phosphorus]
Whenua
Sustainability
Water
Compare nitrogen and phosphorus levels in your rivers against national bottom lines.
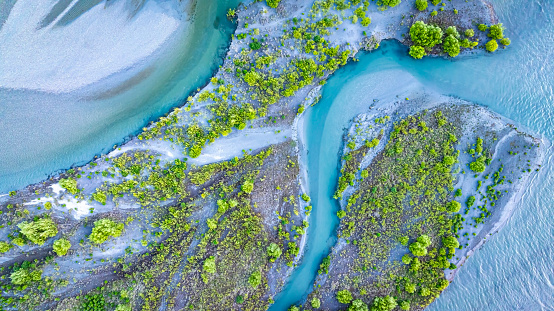
This dataset compares measured E. coli levels in Aotearoa's rivers against the national bottom lines set for safe freshwater.
For each river segment it gives several E. coli statistics, the median, and how often and how badly the water exceeds the safe threshold, plus the annual E. coli load carried by the catchment. A segment sitting above the bottom line is not meeting the national standard.
The figures come from a statistical model, built by Ton Snelder and colleagues, that predicts these statistics from catchment characteristics and compares them against the thresholds set in the National Policy Statement for Freshwater Management. The analysis already uses all the monitoring data available, so results are more reliable at a catchment or regional scale than for judging a single farm.
Compare nitrogen and phosphorus levels in your rivers against national bottom lines.
Read the report behind Aotearoa's freshwater E. coli, sediment and nutrient maps.
Explore maps showing how livestock density affects water quality in New Zealand rivers.
Check the E. coli runoff risk score for land in your rohe or catchment.
Check the predicted redox state of groundwater beneath your rohe.
Look up the nitrogen parameters behind Aotearoa's catchment nutrient models.
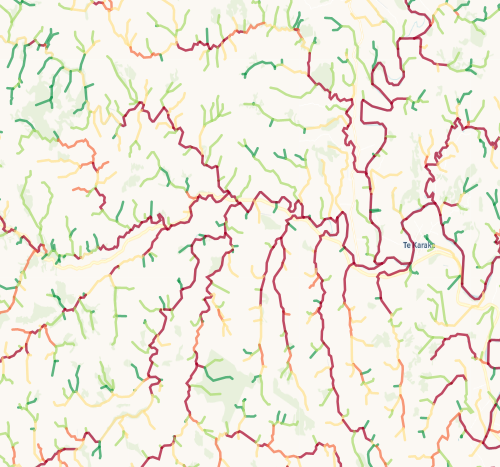
Check which streams on your whenua are most vulnerable to bank erosion.
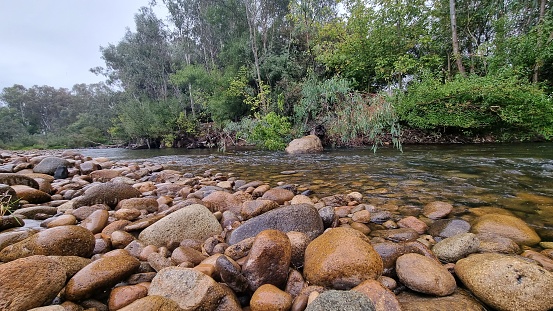
Compare sediment levels in your local rivers against national bottom lines.
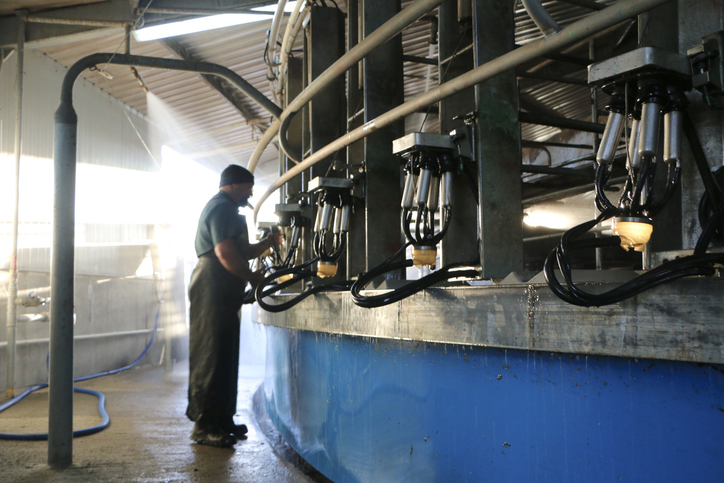
Explore national data about dairy herds and production.
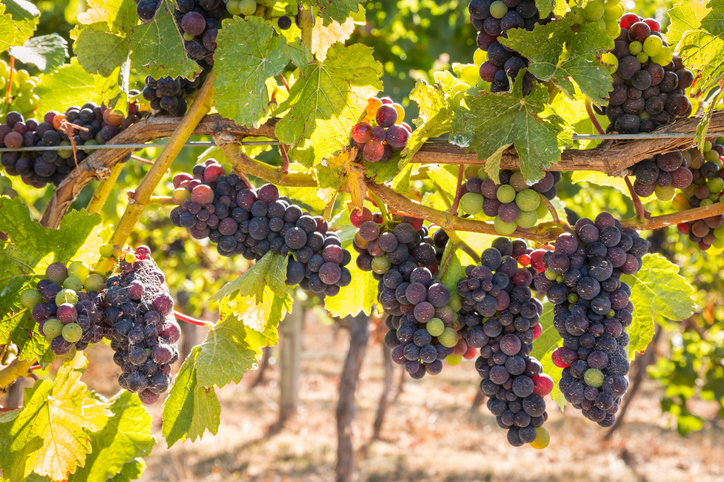
Check the operating profit Pinot noir grapes could earn on the whenua in your rohe each year.
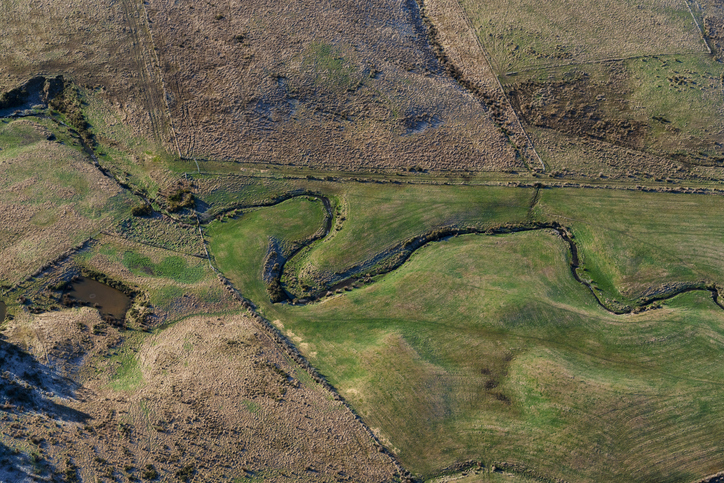
A freshwater farm plan can help you protect freshwater in your rohe. In some cases you might be required to have one.
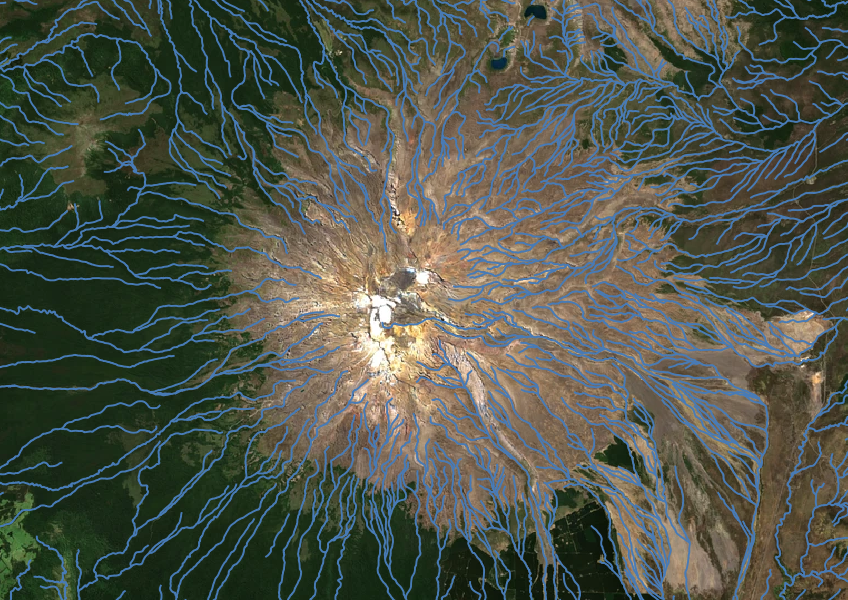
Download a dataset of named and unnamed river lines data for use in your analysis.
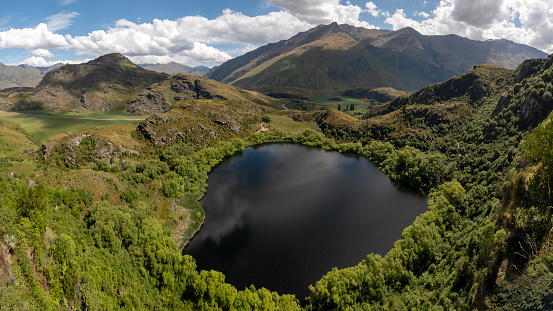
Explore how land use changes affect water quality and nitrogen, phosphorus loads.
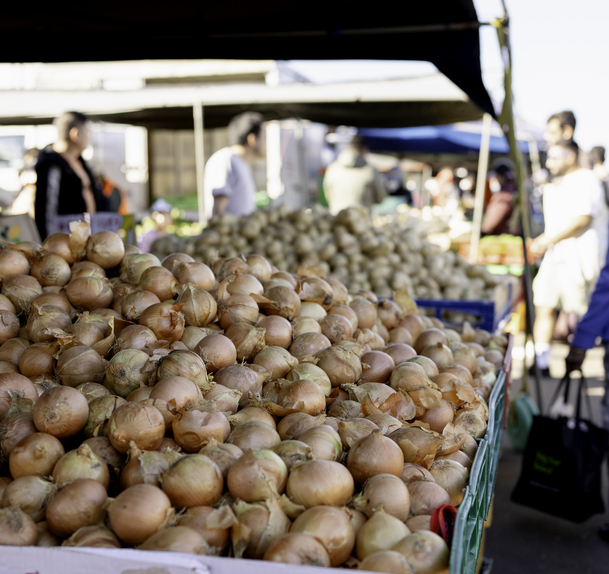
Explore how much onions the whenua in your rohe could produce each year.
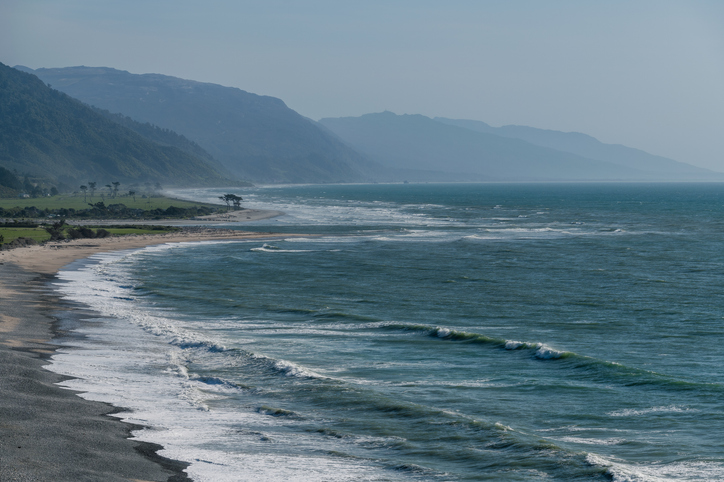
The SOE report shows the West Coast's natural resource trends and areas for improvement.
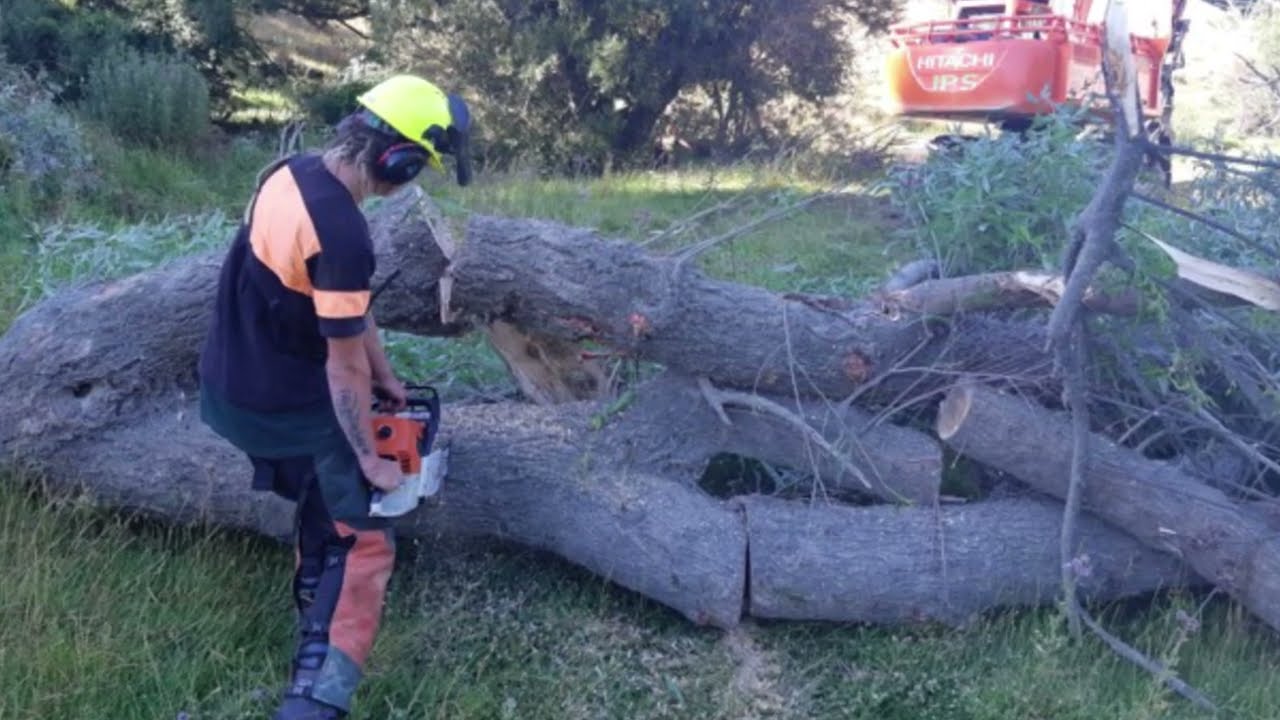
See how over 40 farms have worked together to improve the Wainuioru catchment.
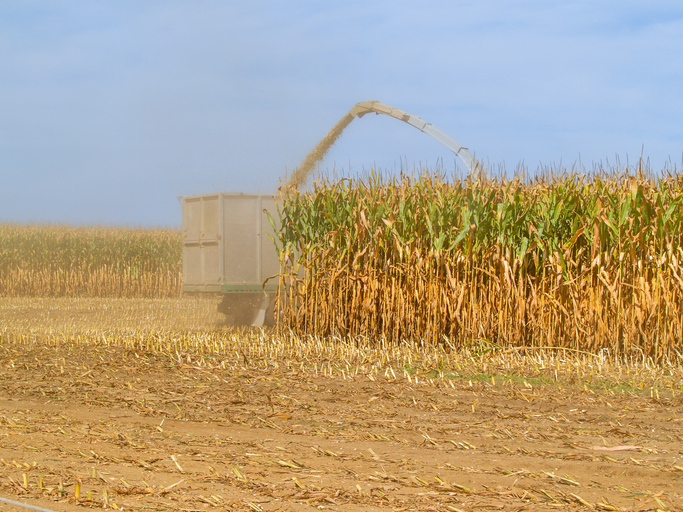
Find out how often heat stress could hit maize in your rohe as the climate changes.
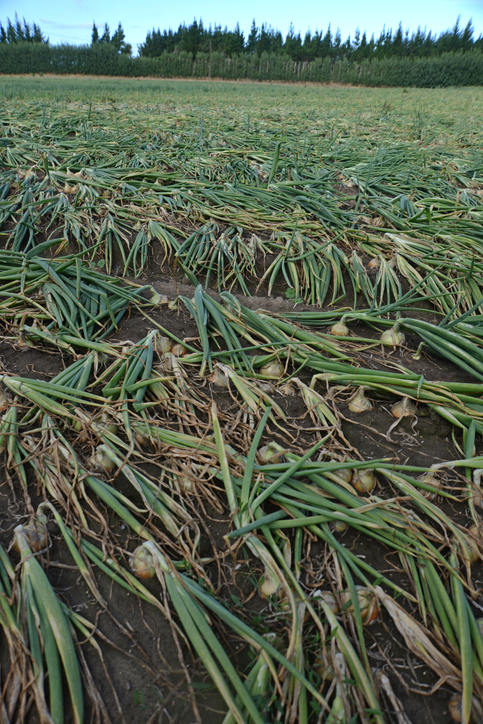
Discover how heat, frost and heavy rain could affect onions in your rohe.
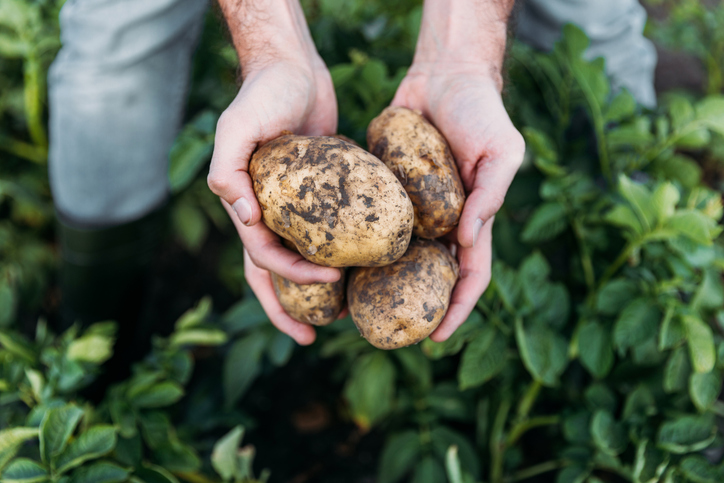
Check how much potatoes the whenua in your rohe could produce each year.
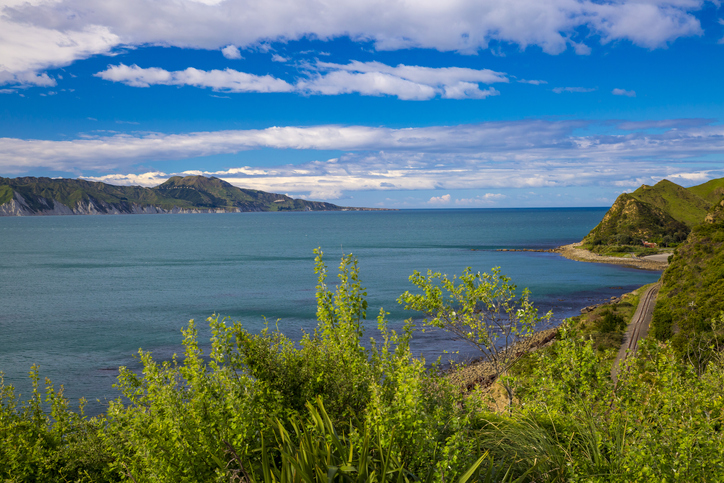
Learn how local groups improved the Whangawehi catchment and river health.
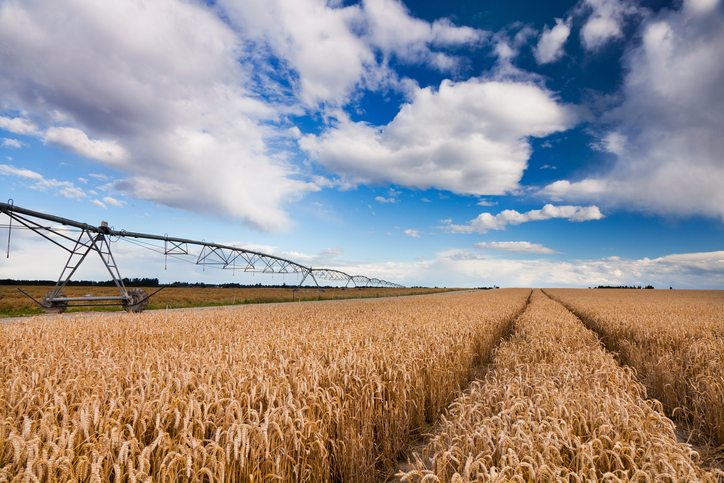
Check how often heat stress could hit wheat in your rohe as the climate changes.
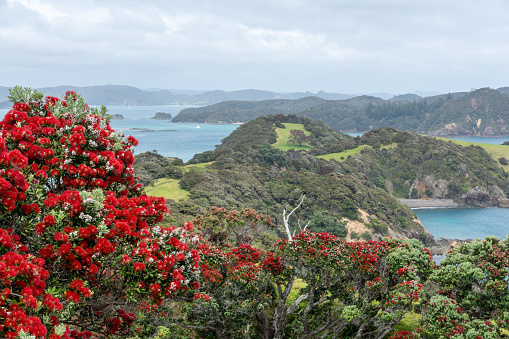
Explore projected temperature and rainfall changes for Aotearoa online.