Current state vs freshwater objectives: E. coli
Whenua
Sustainability
Water
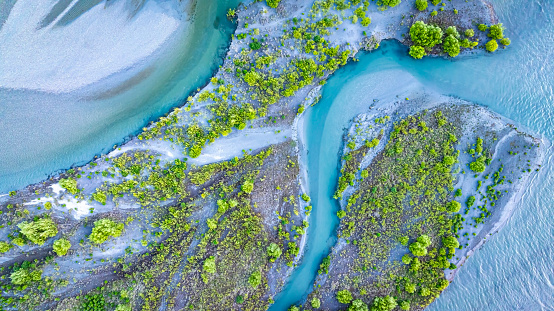
Compare E. coli levels in your local rivers against national bottom lines.
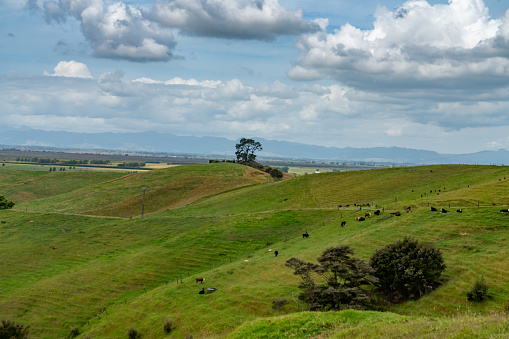
This dataset predicts the redox state of groundwater across Aotearoa, an indicator of how much oxygen is in the water and, in turn, how well it can break down nitrogen naturally.
It classifies groundwater as oxic, mixed or reduced; reduced groundwater has the least oxygen and the greatest potential to remove nitrogen before it reaches a stream, which matters for judging how much of the nitrogen applied on land actually ends up in waterways.
ESR and Lincoln Agritech built a statistical model linking the redox state measured at wells to physical variables such as soil, geology and land surface, documented in a forthcoming paper. The resolution is relatively coarse and reflects the groundwater data available at the time.
Compare E. coli levels in your local rivers against national bottom lines.
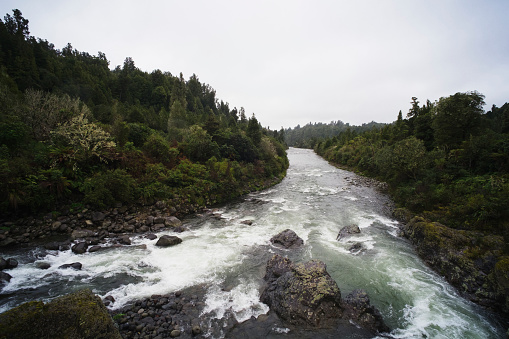
Compare nitrogen and phosphorus levels in your rivers against national bottom lines.
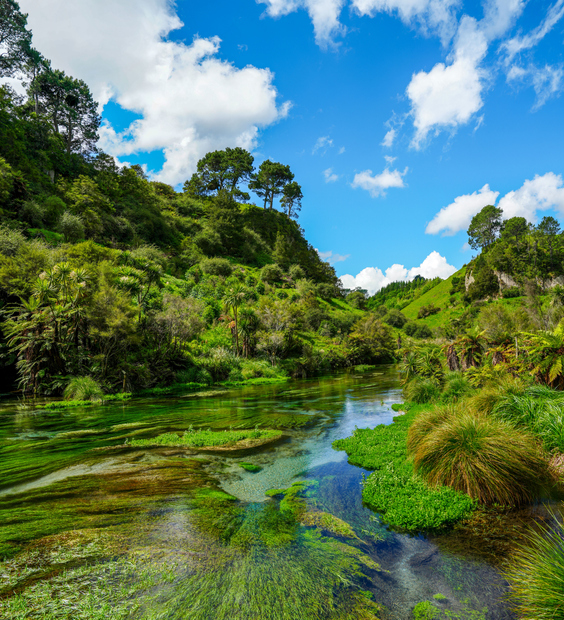
Read the report behind Aotearoa's freshwater E. coli, sediment and nutrient maps.
See how susceptible your soil and climate are to nitrogen loss each month.
Find data on how climate change affects water in Aotearoa’s rivers and groundwater.
The SOE report shows the West Coast's natural resource trends and areas for improvement.
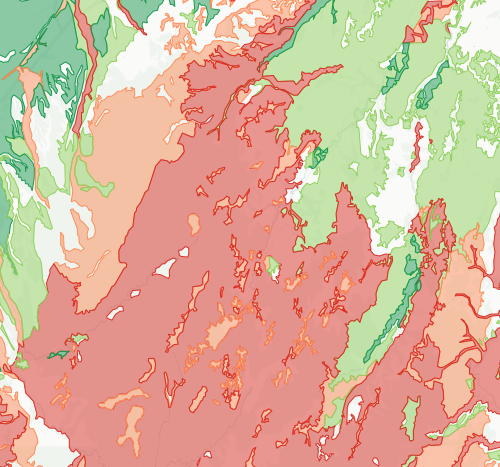
Check how likely nitrogen is to leach through your soil
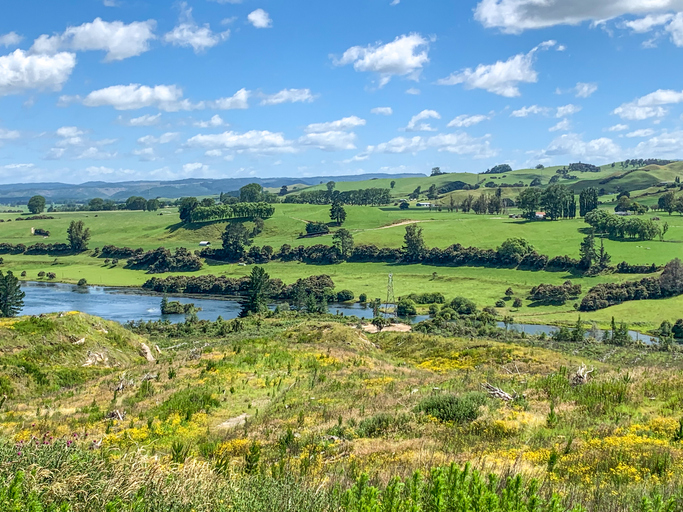
These reports break down Aotearoa's greenhouse gas emissions by sector and type.
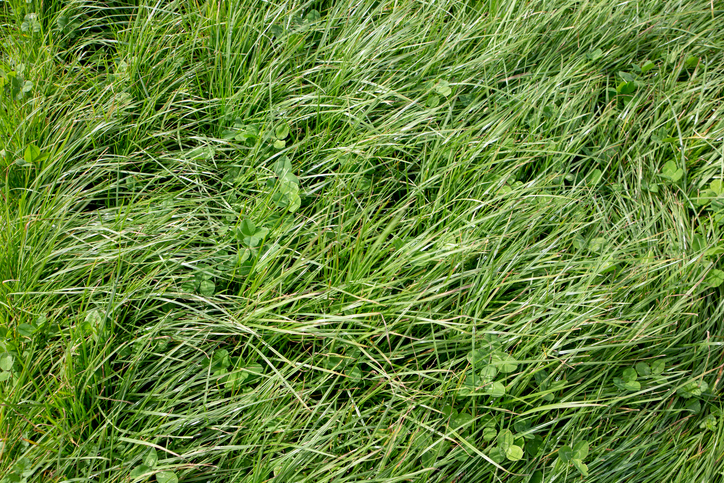
Find out how much drier your pasture could get by 2050 as the climate changes.
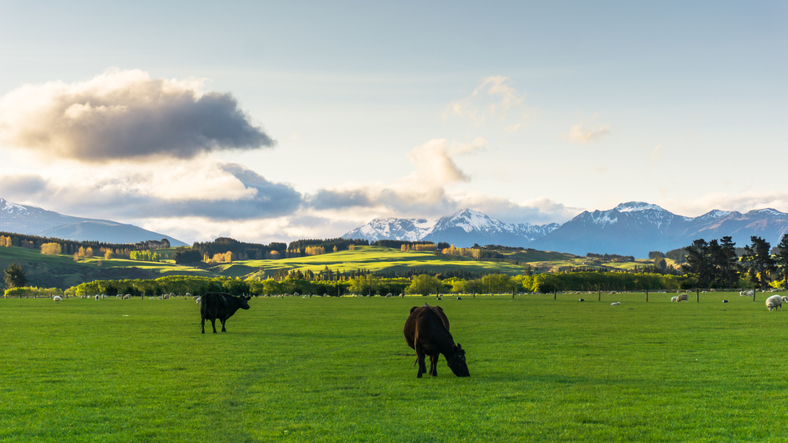
Compare nitrogen, phosphorus and greenhouse gas losses across sheep and beef farm types.
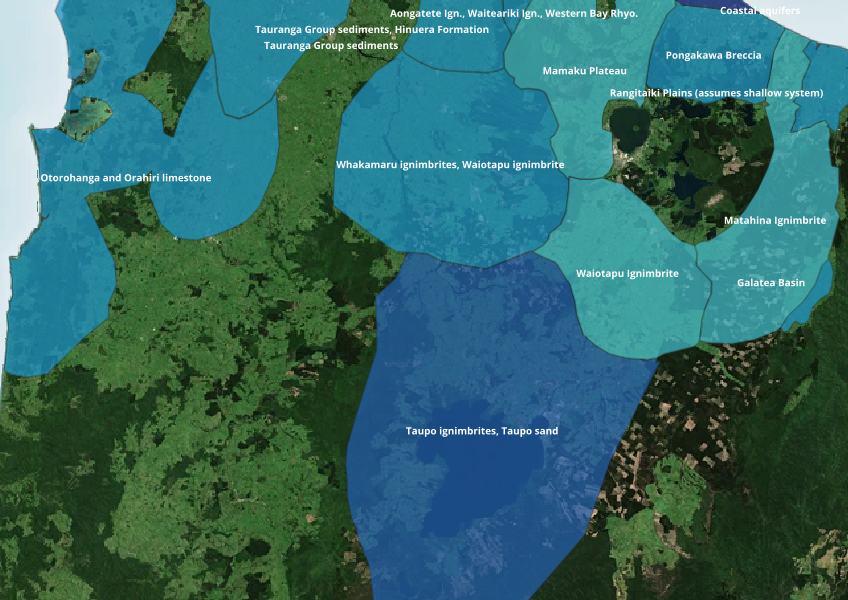
Find out where you might be able to access groundwater in your rohe.
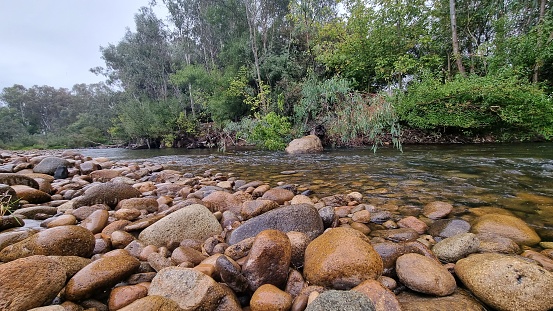
Compare sediment levels in your local rivers against national bottom lines.
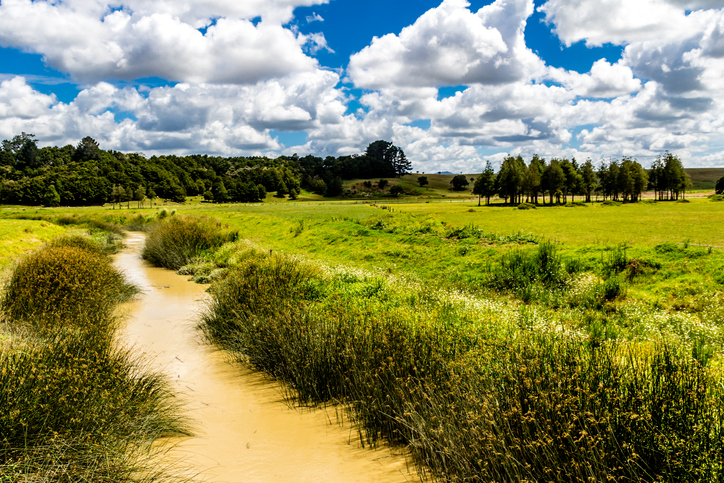
Check the E. coli runoff risk score for land in your rohe or catchment.
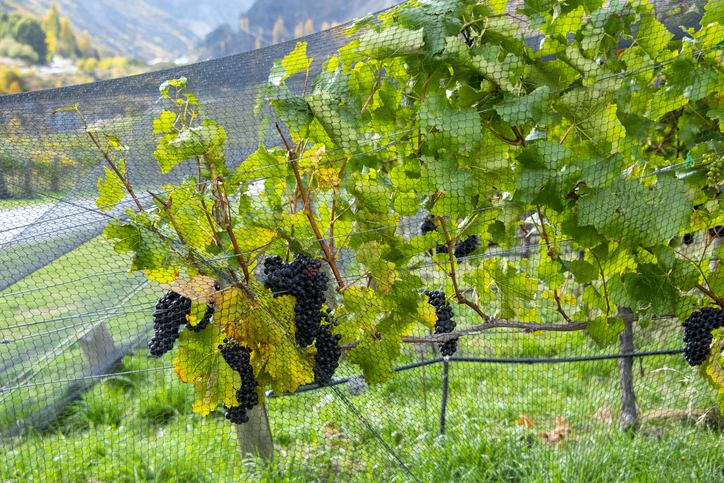
Discover how much Pinot noir grapes the whenua in your rohe could produce each year.
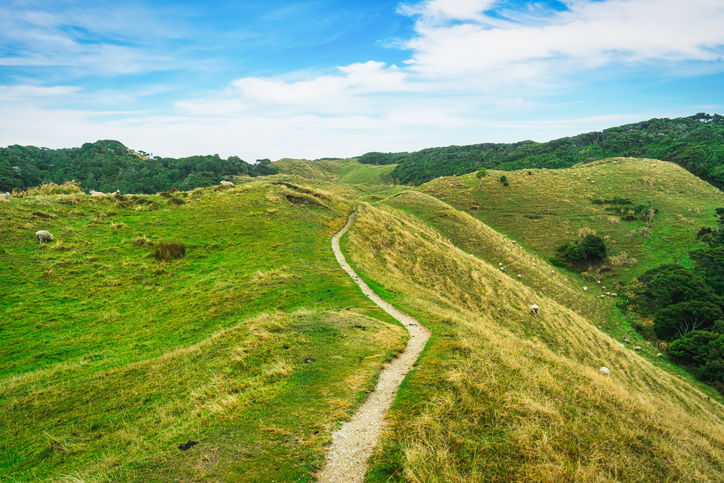
This study models soil loss, which is a major issue for Aotearoa farms and the environment.
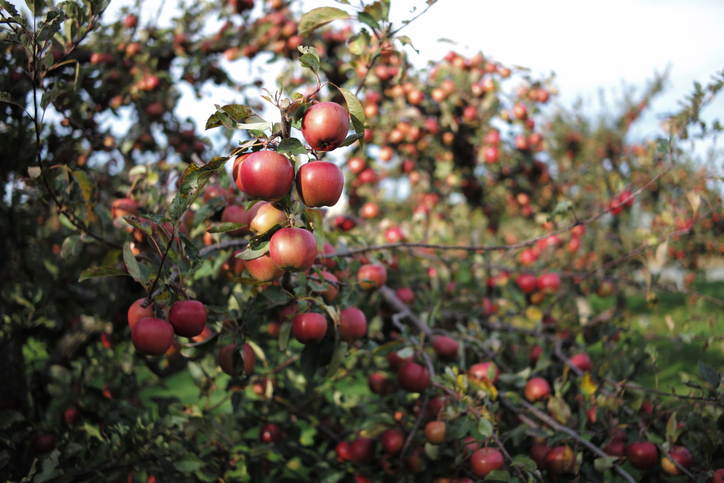
Learn how much apples the whenua in your rohe could produce each year.
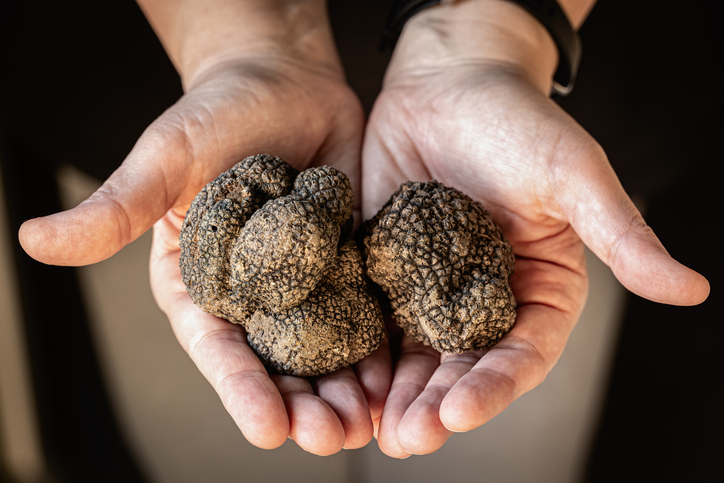
Compare how much truffles the whenua in your rohe could produce each year.
See how much nitrogen your crop rotation could leach into the ground.
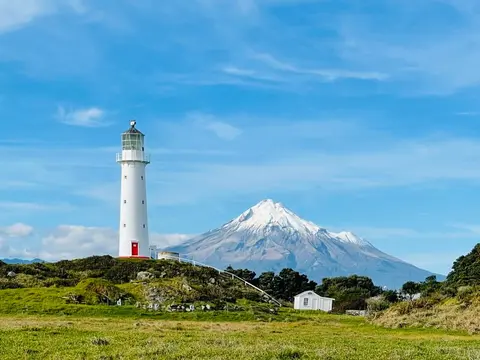
Check live rainfall, river level and water quality readings across Taranaki.
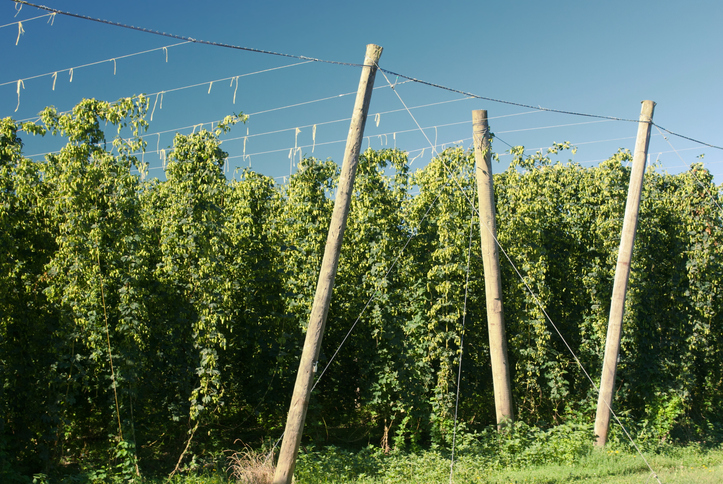
Compare how much hops the whenua in your rohe could produce each year.
Find out what water you can take in Manawatū-Whanganui without consent.
View drought intensity data and charts for your region. Updated monthly.