Nitrate-nitrogen leaching from dairy livestock 2017
Whenua
Dairy
Emissions reduction
Water
Map showing nitrate-nitrogen leaching from dairy farms, with spatial accuracy at 100m resolution.
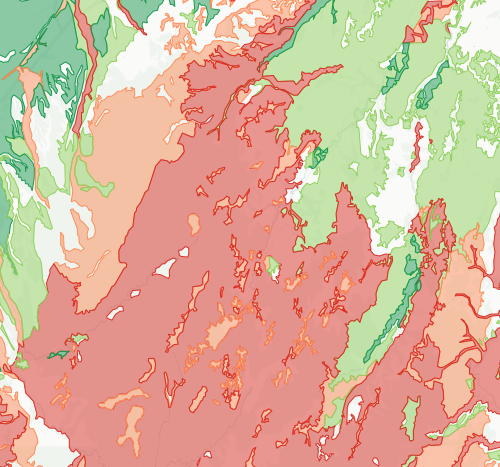
This data shows how vulnerable your soil is to nitrogen leaching -- where nitrogen from fertiliser and animal urine is most likely to wash down through the soil and into groundwater. Soils rated "Very High" let nitrogen through quickly, while "Very Low" soils hold onto it better.
If your whenua has high leaching susceptibility, you will need to be more careful with how much nitrogen you apply and when you apply it. This is relevant as councils tighten freshwater rules and nutrient limits.
The data comes from S-map, Manaaki Whenua's detailed soil database, which is generated by combining information from expert soil surveyors with historical soil mapping and other data sources.
Sourced from Manaaki Whenua – Landcare Research under a Creative Commons Attribution-NonCommercial-NoDerivs 3.0 New Zealand (CC BY-NC-ND 3.0 NZ) licence.
Map showing nitrate-nitrogen leaching from dairy farms, with spatial accuracy at 100m resolution.
This guide explains how to cut nitrogen use, reducing nitrous oxide emissions on farms.
Learn about the terrestrial nitrogen cycle and the impacts of different farming activities.
See how susceptible your soil and climate are to nitrogen loss each month.
See how much nitrogen your crop rotation could leach into the ground.
Use the N-Cap Webform to report synthetic nitrogen use on your dairy farm.
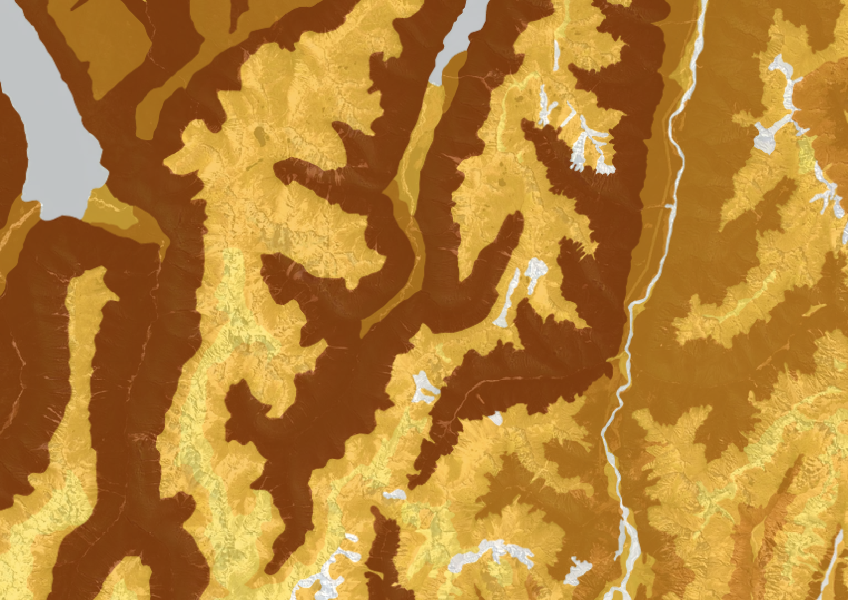
This dataset shows soil cation exchange capacity which can help you understand soil health.
Get high-level soil classification data for Te Ika a Māui to help with land use decisions.
Access livestock manure data for N inputs and losses.
Learn how to manage nitrogen fertiliser use for better pasture growth and environmental outcomes.
Find out about a no-cost method to reduce your dairy farm's greenhouse gas emissions.
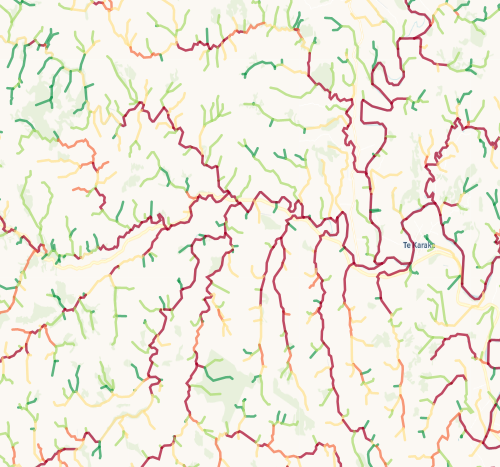
Check which streams on your whenua are most vulnerable to bank erosion.
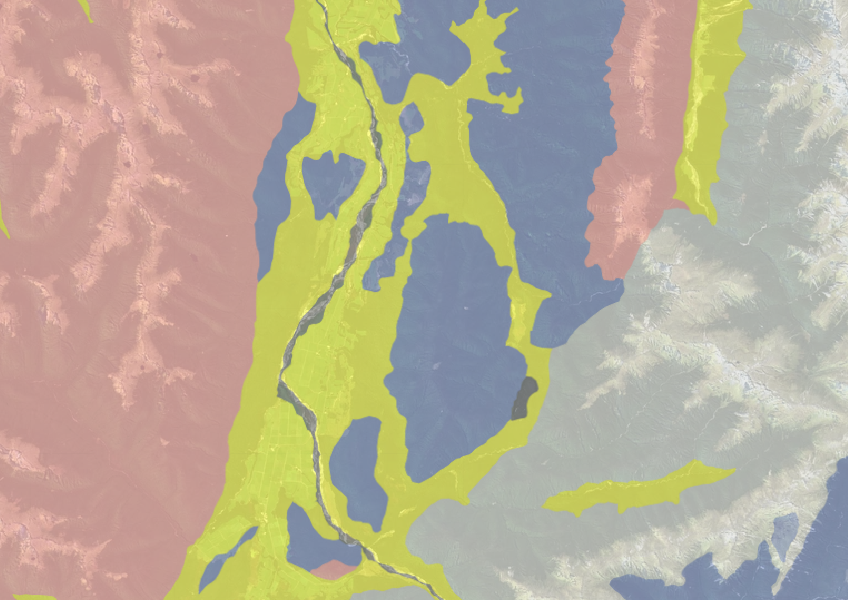
Use the NZLRI rock dataset to understand what type of rock is under your whenua.
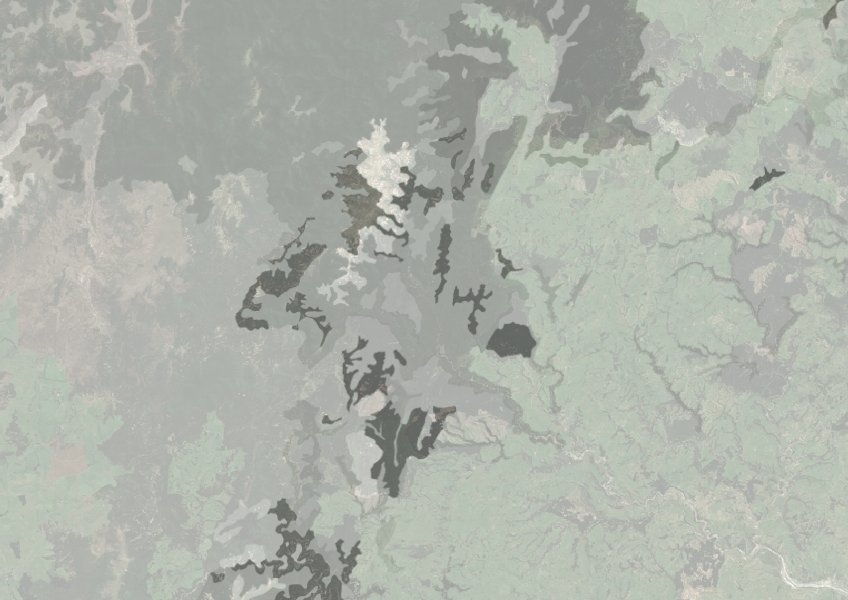
Understand how rocky your whenua is so you can make better land use decisions.
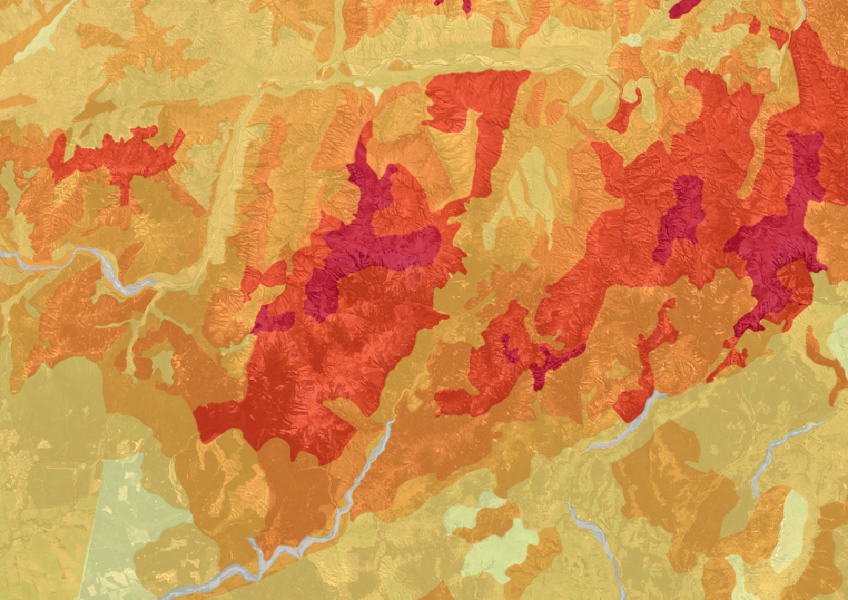
This map shows erosion types and estimated severity across Aotearoa.
Learn about the phosphorus cycle and its role in plant and animal growth.
Get high-level soil classification data for Te Wai Pounamu to help with land use decisions.
Explore soil drainage classes for land use and growth insights.
Guidance for dairy farmers on complying with the synthetic nitrogen fertiliser cap regulations.

Check how well suited the whenua in your rohe is to producing mānuka honey.
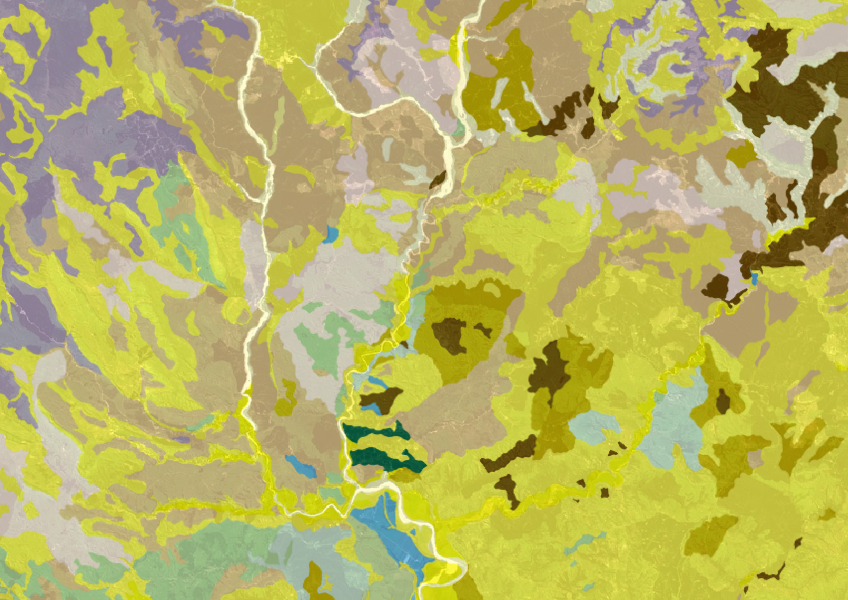
Get a better understanding of soil types on your whenua and across Aotearoa.
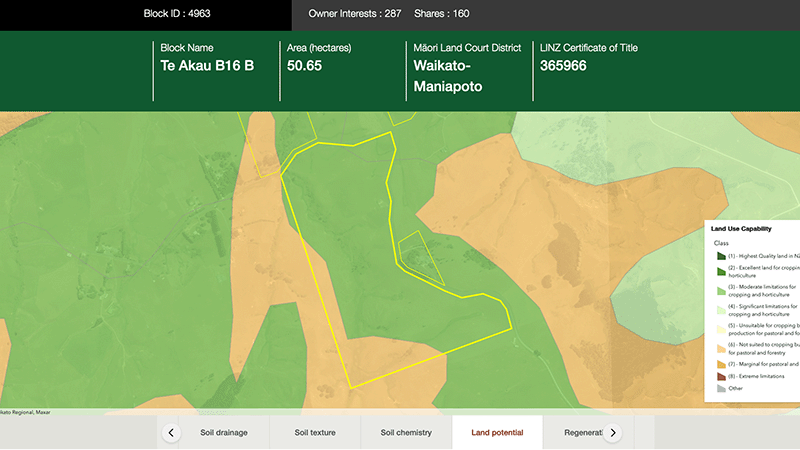
Explore different regulatory, soil, water, and land potential maps for your whenua.
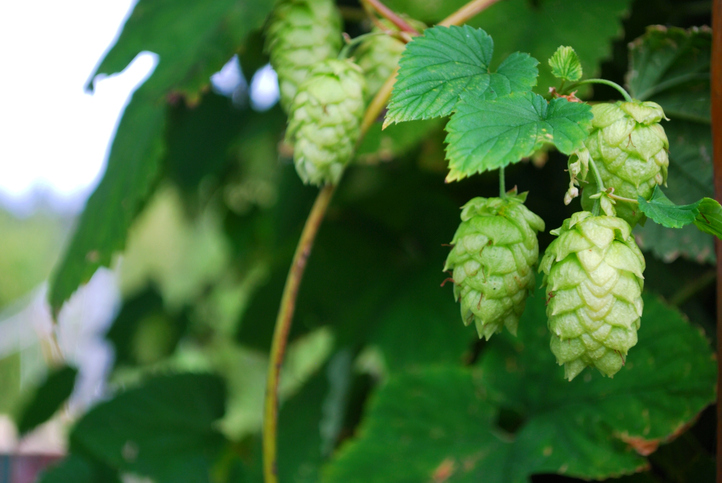
Discover how well suited the whenua in your rohe is to growing hops.