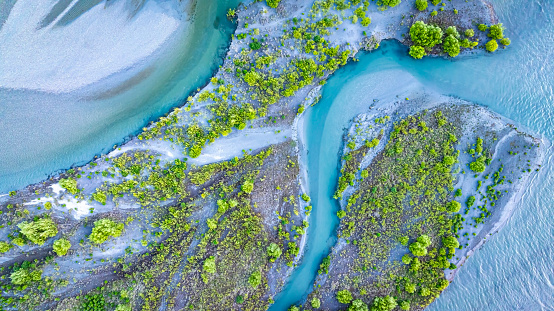
Current state vs freshwater objectives: E. coli
Whenua
Sustainability
Water
Compare E. coli levels in your local rivers against national bottom lines.
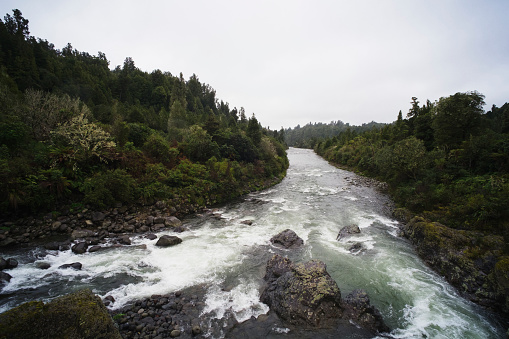
This dataset compares measured nitrogen and phosphorus levels in Aotearoa's rivers, lakes and estuaries against the national bottom lines set for safe freshwater.
For each watershed it gives the excess nitrogen and phosphorus load, in kilograms per hectare per year, above the national bottom line. A watershed with a large excess load is further from meeting the national standard.
The figures come from a statistical model, built by Ton Snelder and colleagues, that predicts nutrient concentrations and loads from catchment characteristics and compares them against the thresholds set in the National Policy Statement for Freshwater Management. The analysis already uses all the monitoring data available, so results are more reliable at a catchment or regional scale than for judging a single farm.
Compare E. coli levels in your local rivers against national bottom lines.
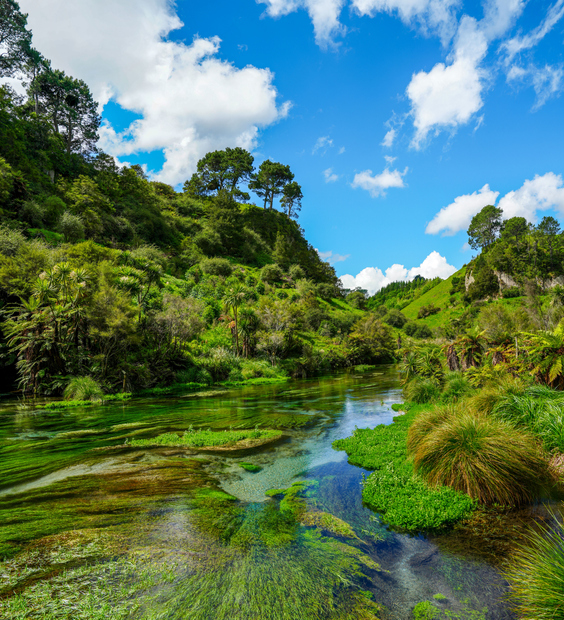
Read the report behind Aotearoa's freshwater E. coli, sediment and nutrient maps.
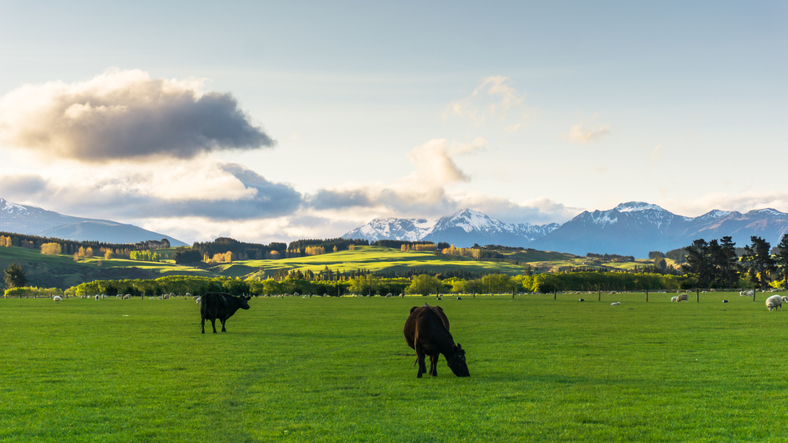
Compare nitrogen, phosphorus and greenhouse gas losses across sheep and beef farm types.
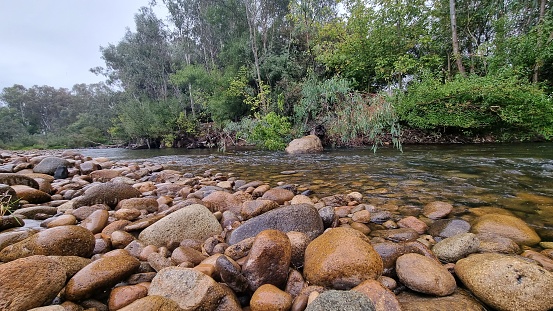
Compare sediment levels in your local rivers against national bottom lines.
See how susceptible your soil and climate are to nitrogen loss each month.

Using radiometrics and local knowledge to map how Southland's landscape affects water quality.
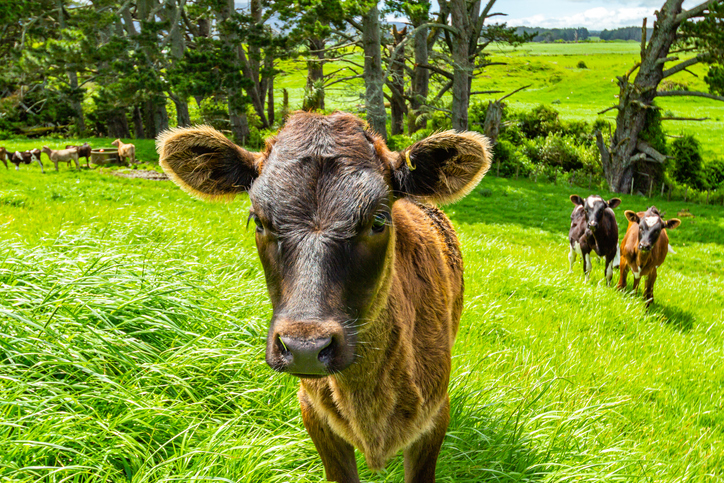
Compare nitrogen, phosphorus and greenhouse gas losses across dairy farm types.
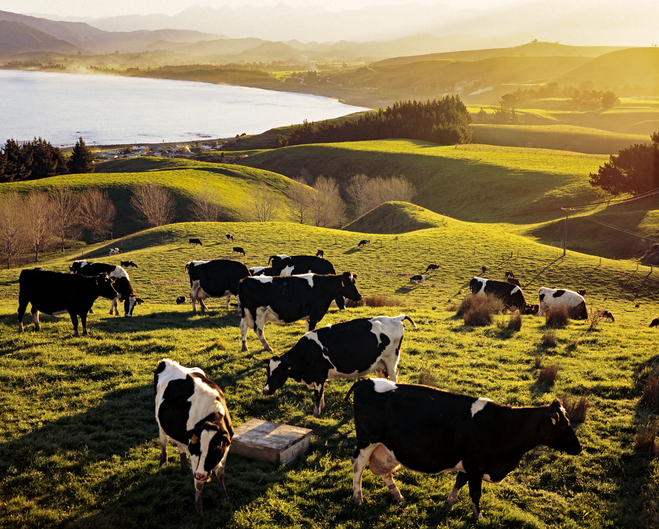
See which sheep and beef mitigation measures cut nutrient loss and emissions.
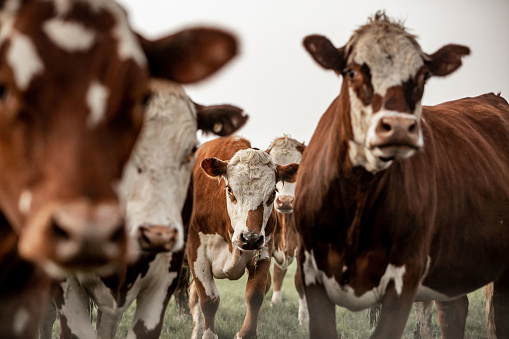
Explore how dairy water-quality measures affect greenhouse gas emissions too.
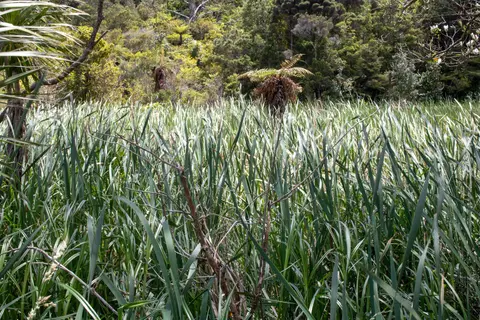
See how Owl Farm's constructed wetland strips nitrogen and sediment from farm runoff.
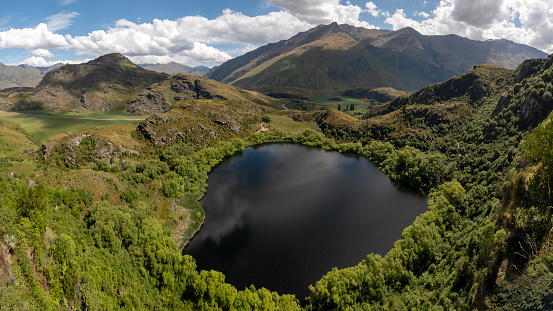
Explore how land use changes affect water quality and nitrogen, phosphorus loads.
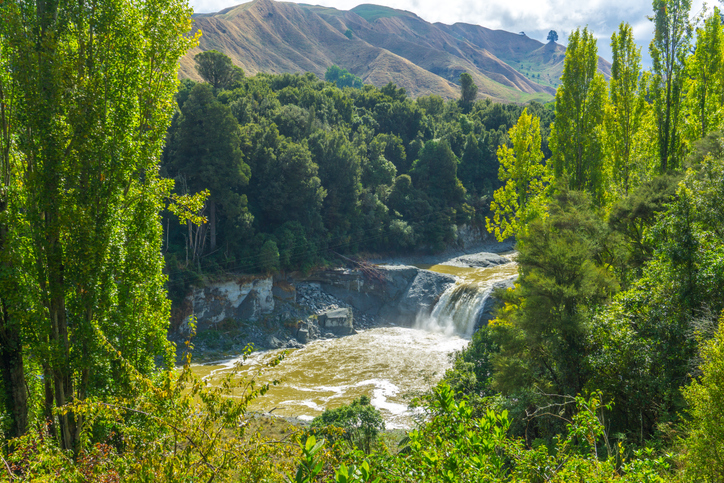
Look up the nitrogen parameters behind Aotearoa's catchment nutrient models.
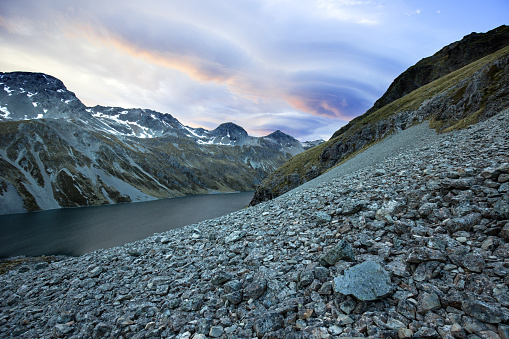
Find out how climate change could shift sediment loads in your local rivers.
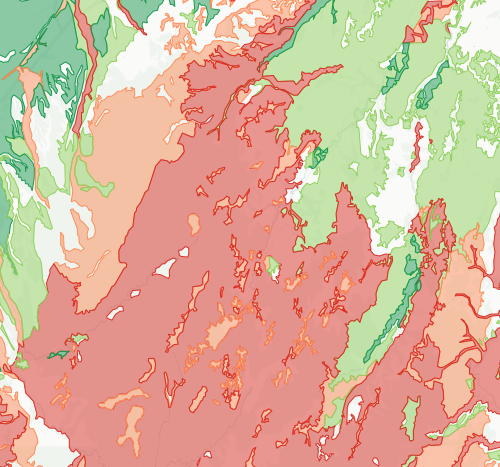
Check how likely nitrogen is to leach through your soil
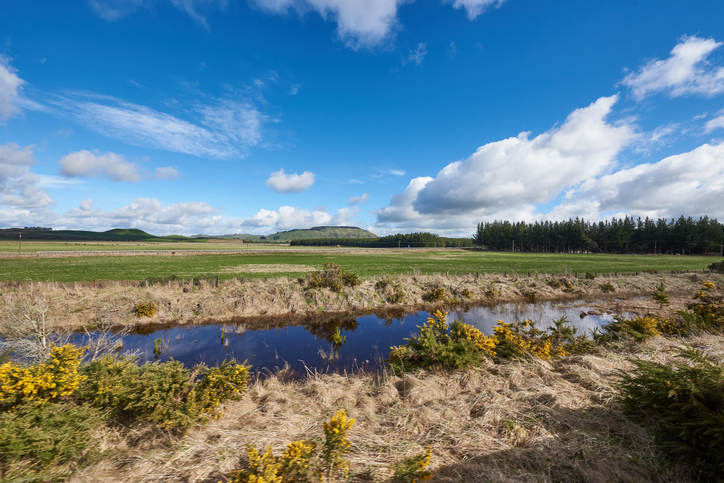
Explore maps showing how livestock density affects water quality in New Zealand rivers.
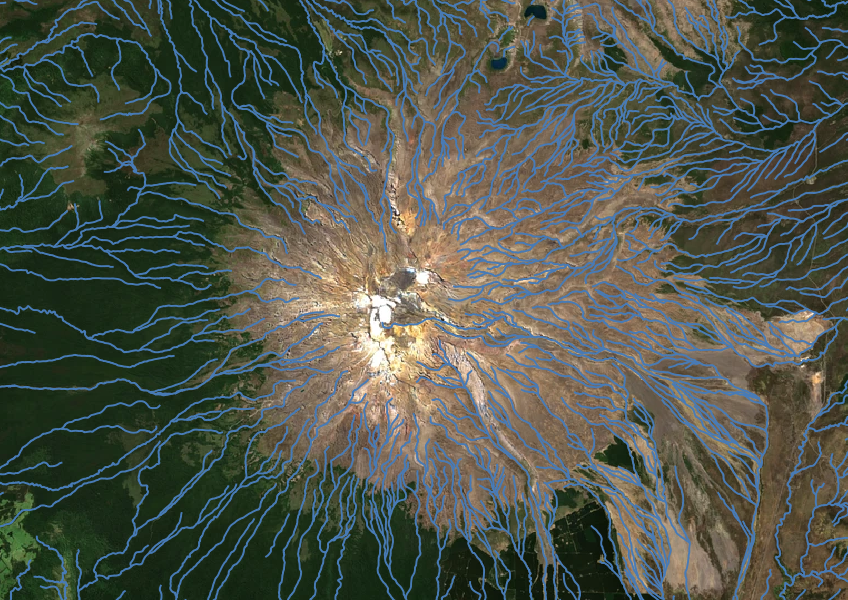
Download a dataset of named and unnamed river lines data for use in your analysis.
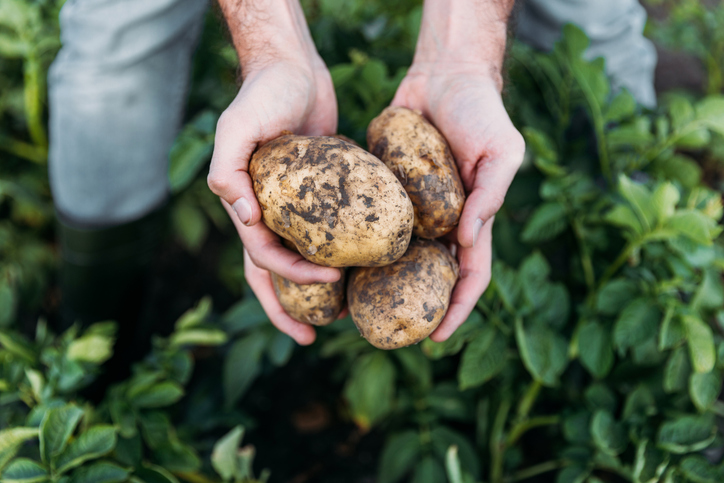
Check how much potatoes the whenua in your rohe could produce each year.
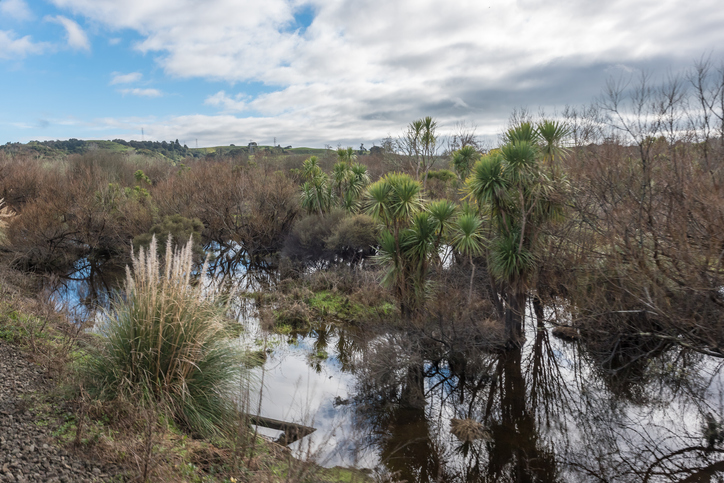
Learn how constructed wetlands treat farm runoff by removing sediment, nitrogen, and phosphorus.
Learn how you can reduce your greenhouse gas emissions while staying profitable.
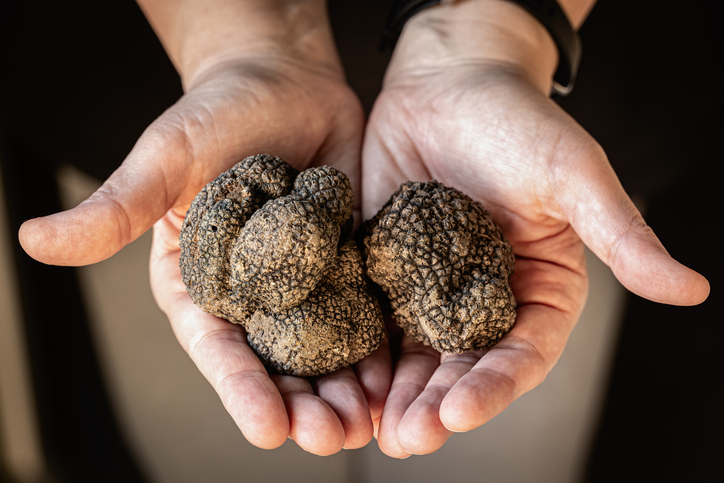
Compare how much truffles the whenua in your rohe could produce each year.
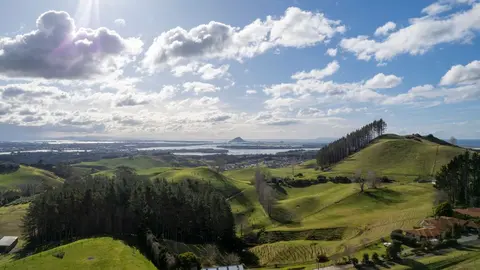
How and why land use in Aotearoa has to change.
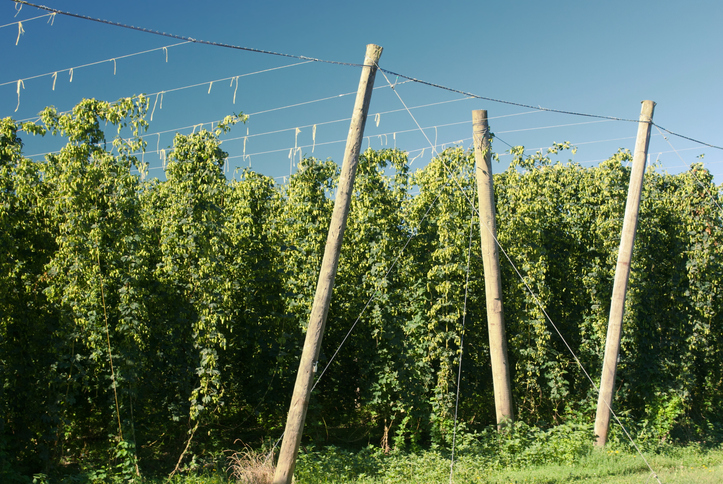
Compare how much hops the whenua in your rohe could produce each year.