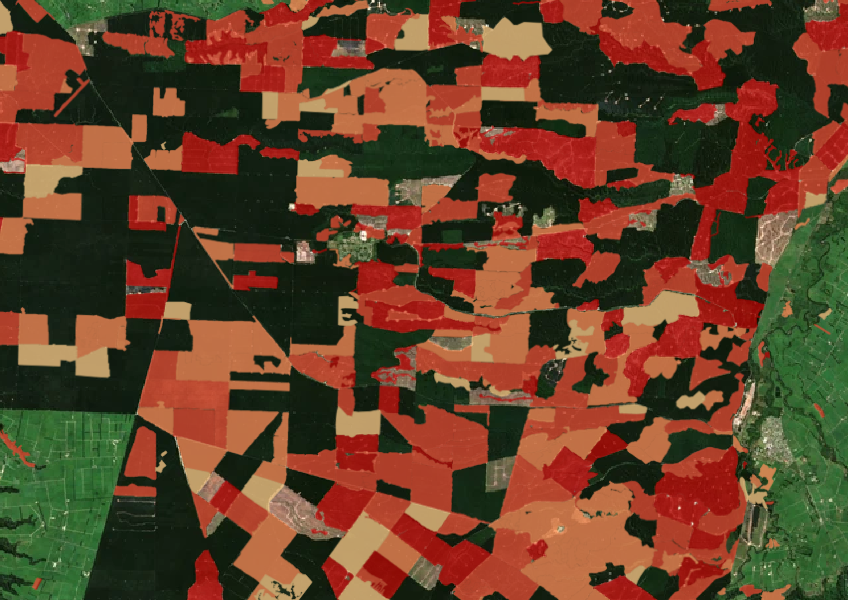
Forest clearing data from 2008 - 2020
Climate
Forestry
Regeneration
Sustainability
See the extent of forested land cleared between 2008 and 2020 shaded by year.
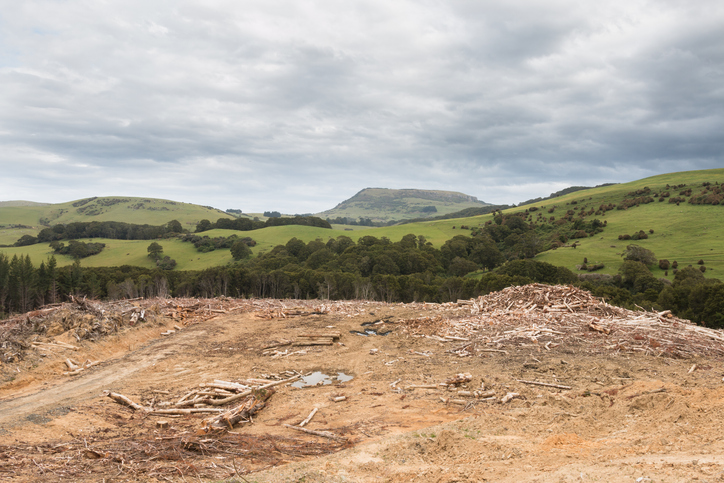
This resource shows the percentage of land that was deforested in each Territorial Authority from 2008 to 2014. You can use this information to compare deforestation rates between different areas. Understanding these rates can help you see how your district is working to capture carbon dioxide (CO2) and offset emissions. Forests, both indigenous and exotic, play a crucial role in this process by absorbing CO2 and storing carbon. The data is based on satellite images, which help identify areas of deforestation. While it provides useful insights, it doesn’t explain the reasons behind the deforestation in each area.
Data supplied by Ministry for the Environment (MfE) licensed under CC BY 4.0.
See the extent of forested land cleared between 2008 and 2020 shaded by year.
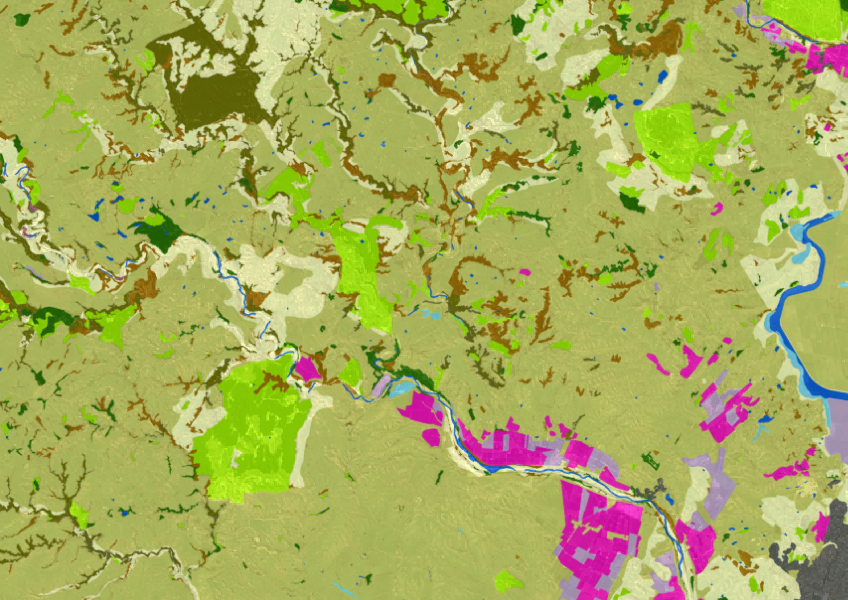
LUCAS is a national dataset that tracks carbon sequestration and land use change over time.
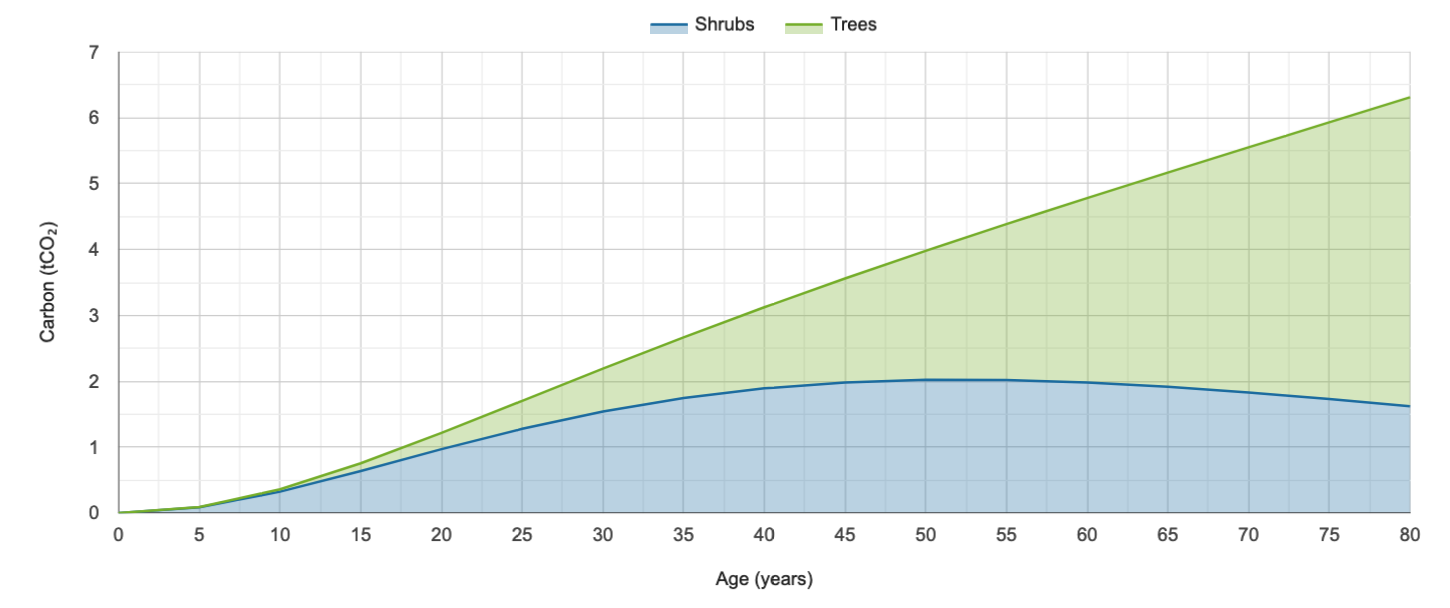
Calculate carbon storage in native forests and find planting needs to offset your footprint.

Find out about carbon sequestration rates in native forests and planting methods in New Zealand.
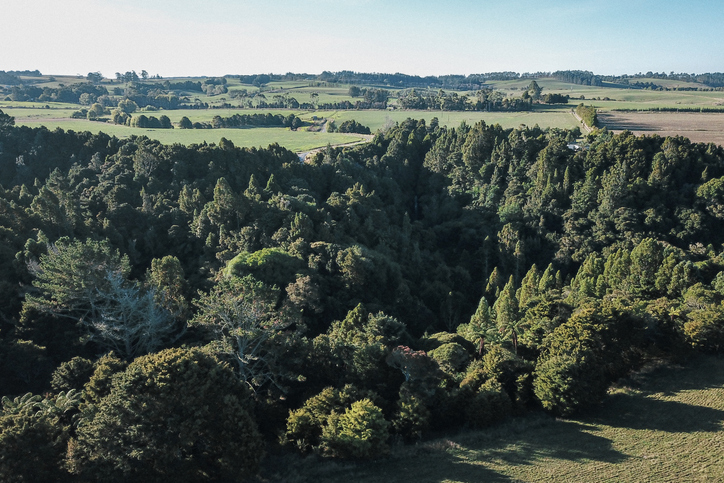
Learn how tree planting on farms can earn carbon credits in the Emissions Trading Scheme (ETS).

Learn about the role tree planting can play in reducing climate change impacts.
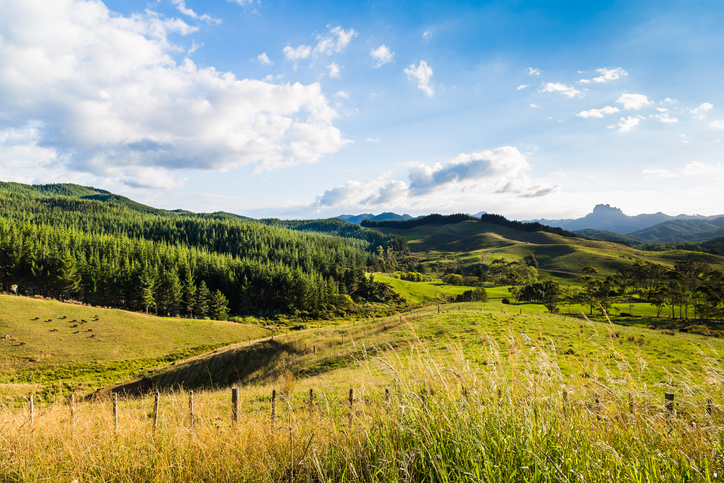
Find out more about tree farming for carbon credits.
Calculate your carbon footprint and learn how to reduce it with tools and tips from Tane's Tree Trust.
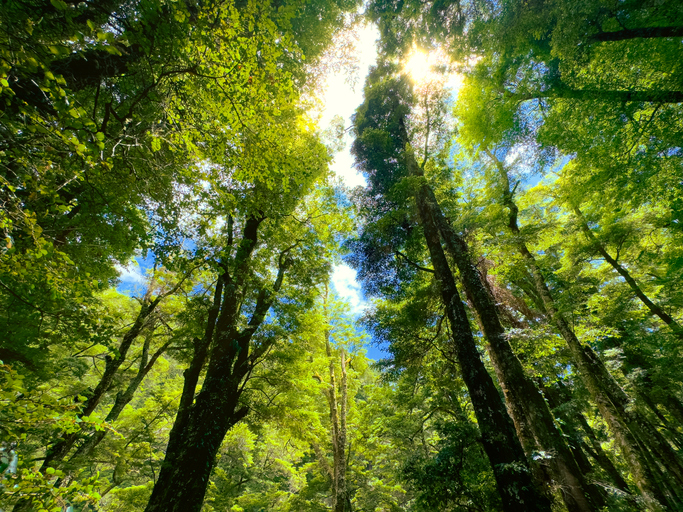
Learn how well-managed native forests can absorb significant amounts of carbon.
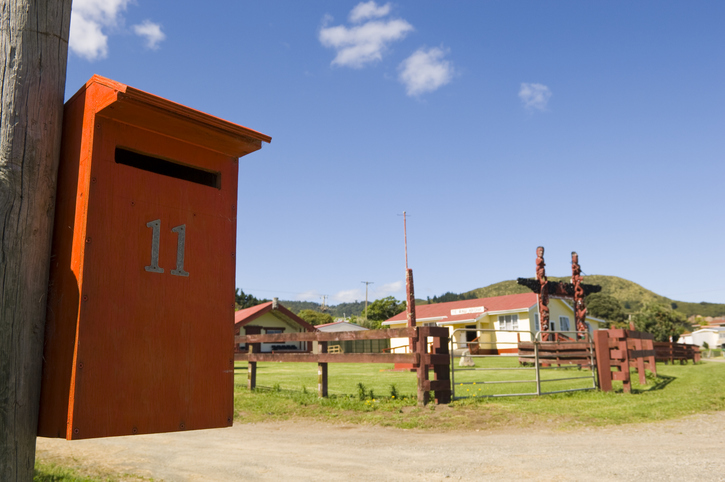
Search for iwi, hapū, and marae info by region or local authority.
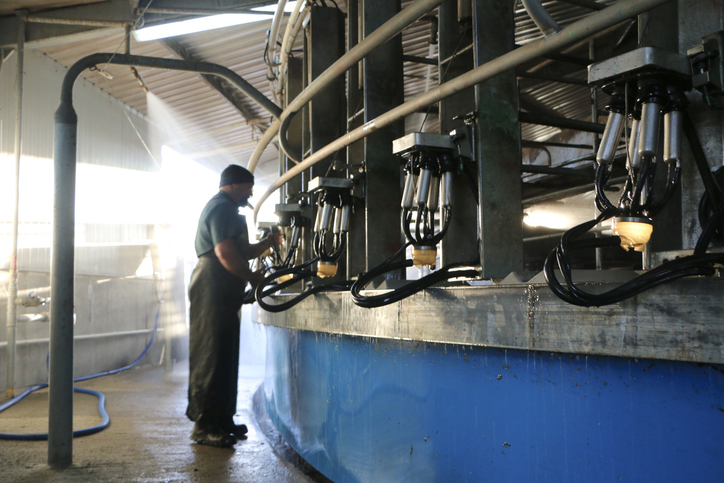
Explore national data about dairy herds and production.
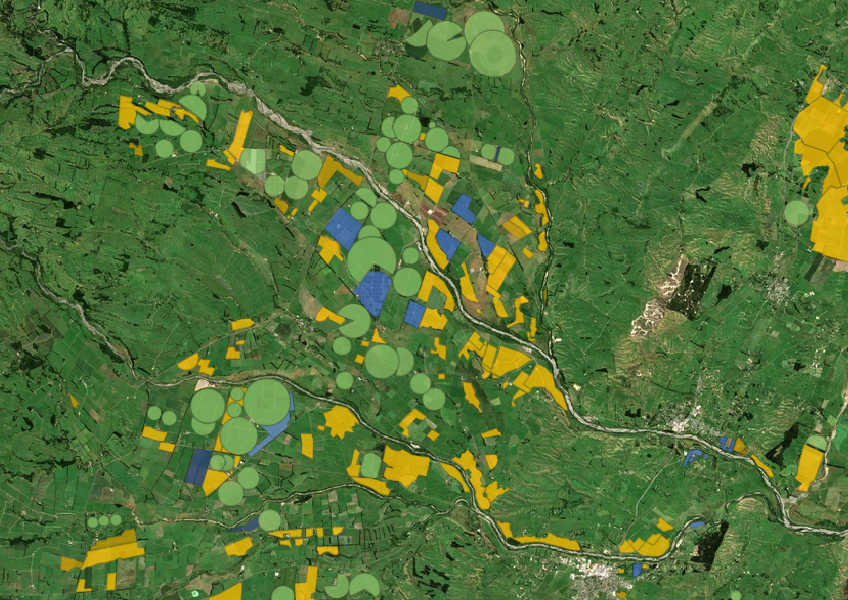
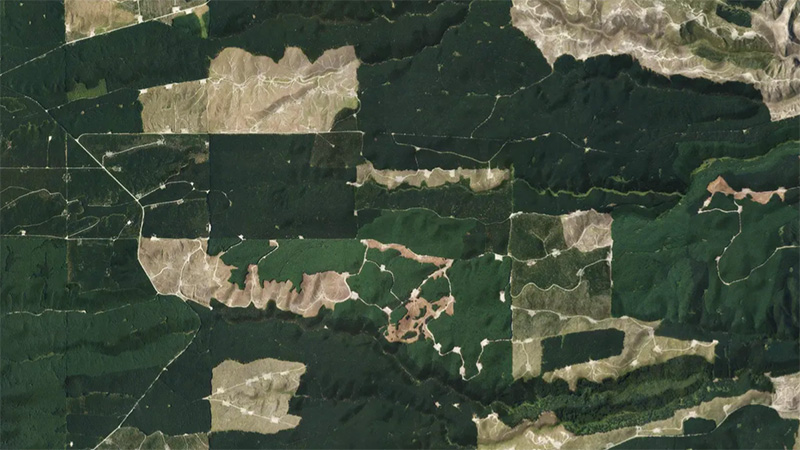
This add-in for Google Earth can help you monitor and analyse forest changes using satellite imagery and public datasets.
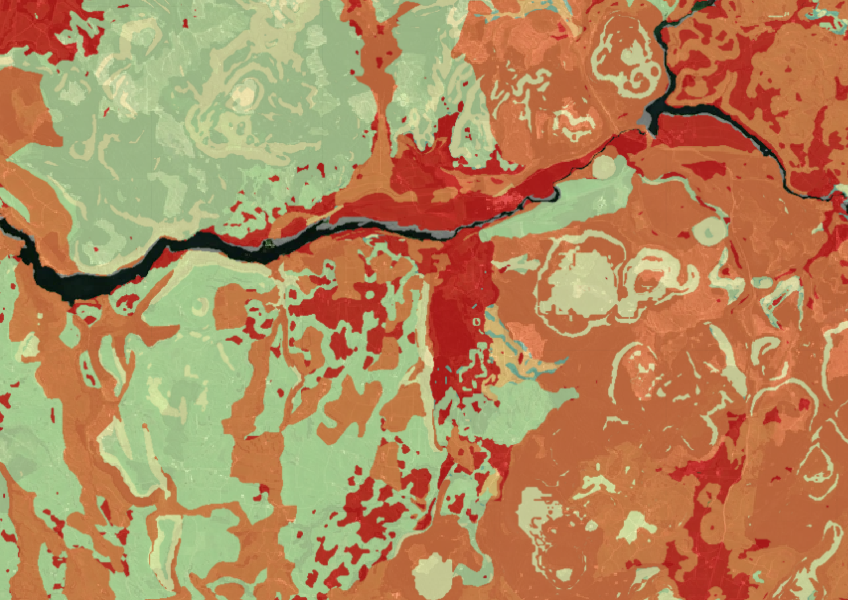
Map showing our remaining indigenous vegetation and its protection status..
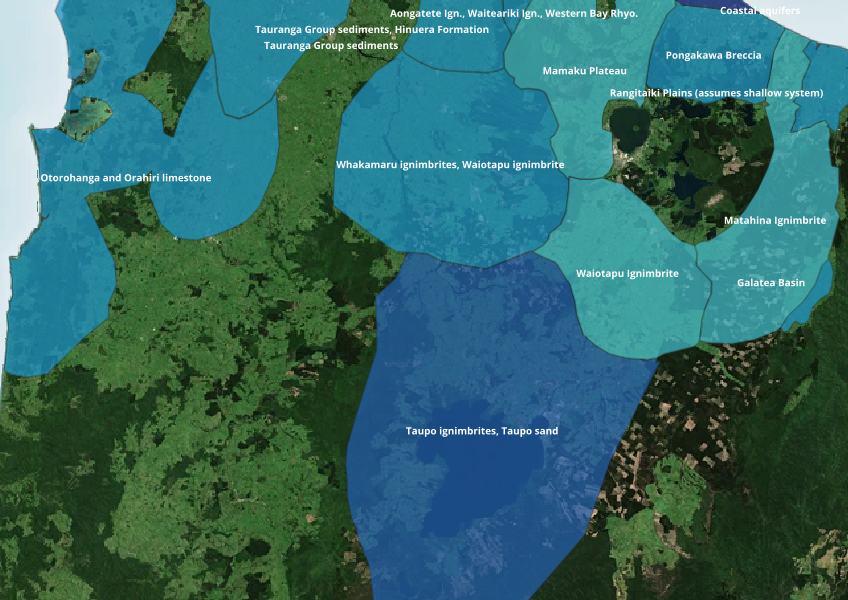
Find out where you might be able to access groundwater in your rohe.
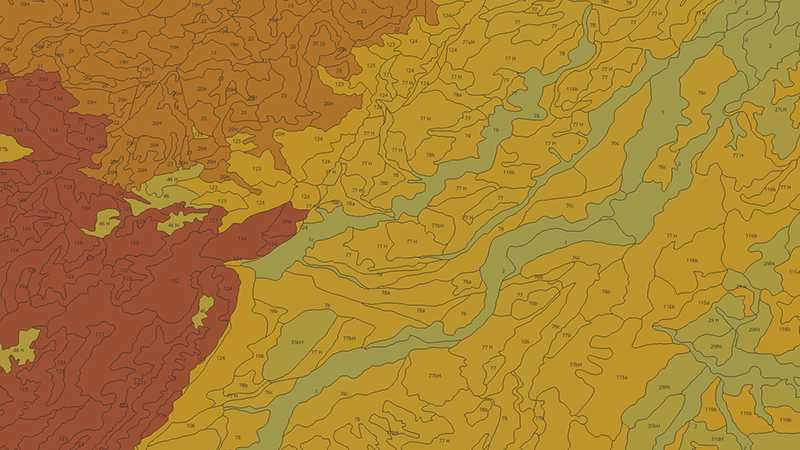
Learn how to measure and map soil carbon to reduce agricultural greenhouse gas emissions.
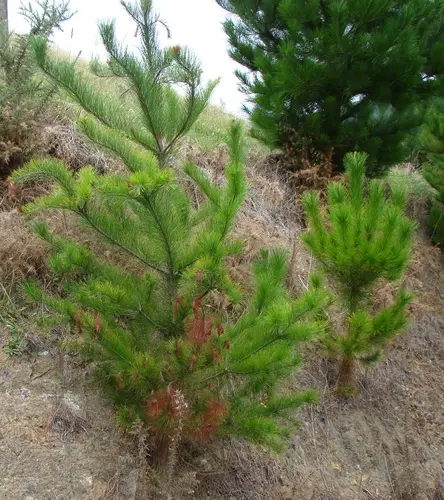
The clash between carbon credits and controlling wilding conifers.
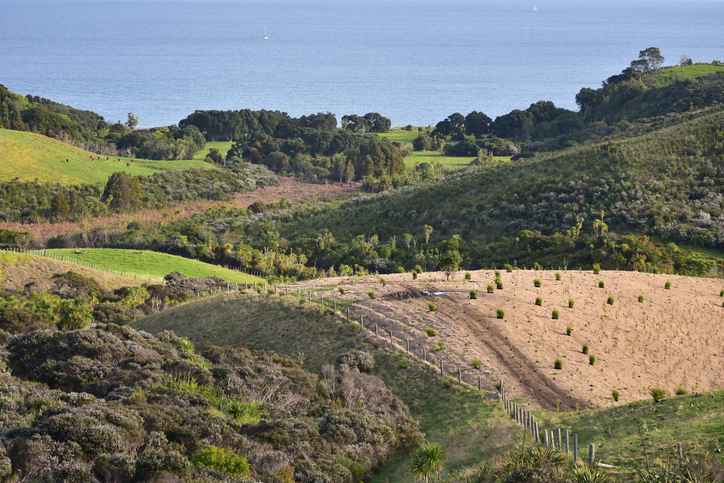
Find out how to convert marginal or depleted agricultural land into native forests for carbon farming.
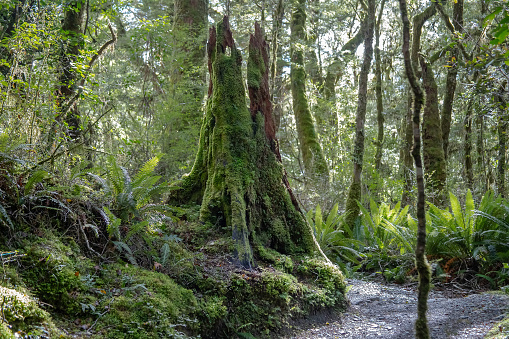
Learn how trees absorb CO2 and help fight climate change in New Zealand.
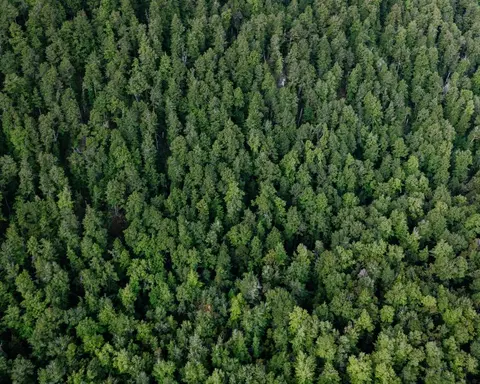
Look up expected carbon stock by forest age for small forests in the ETS.
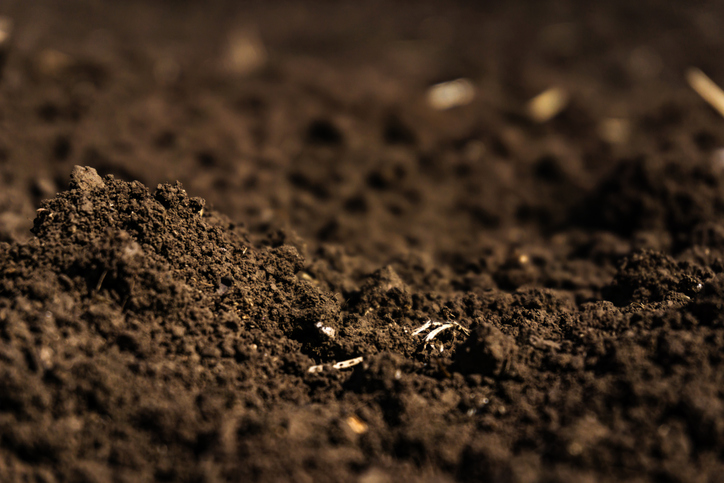
Learn how soil carbon impacts climate change and things you can do on your farm to offset your emissions.
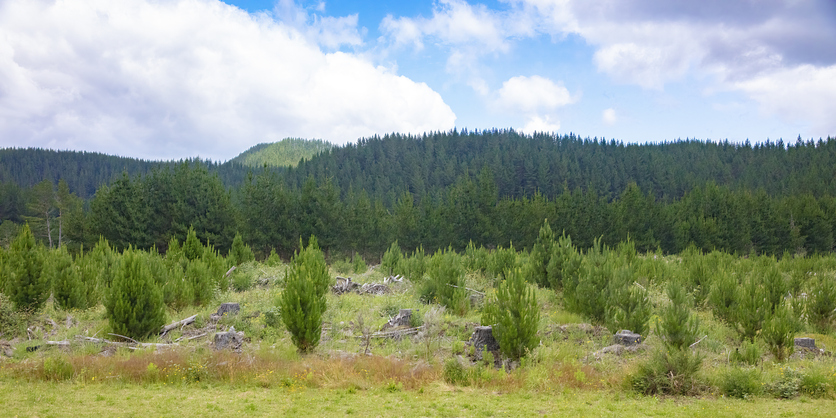
This paper discusses carbon farming on Māori land, its benefits, and decision-making challenges.
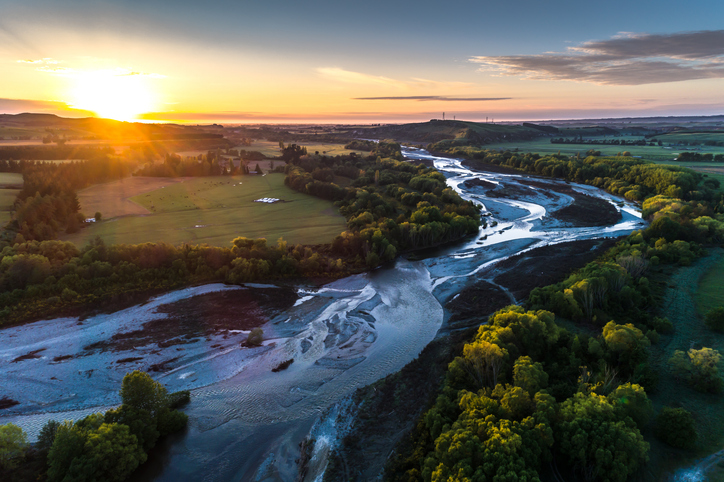
A comprehensive dataset of Aotearoa river catchments that drain to the sea.