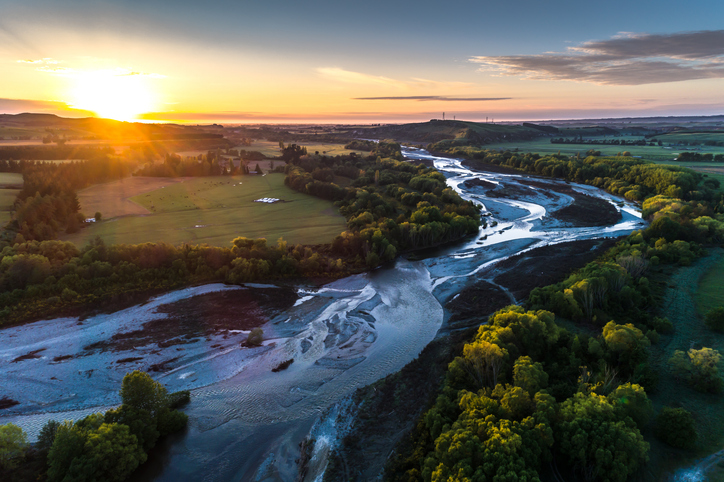
Sea-draining river catchments
Whenua
Community
Flooding
Planning
Water
A comprehensive dataset of Aotearoa river catchments that drain to the sea.
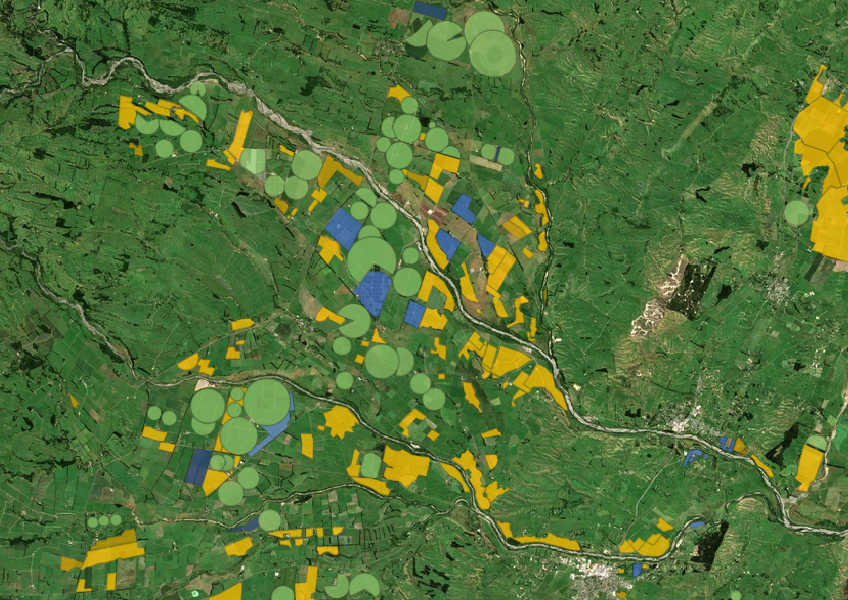
This dataset combines data from aerial imagery, Regional Councils, and resource consents to identify irrigated land across the motu. It shows whether specific land blocks are irrigated and what type of irrigation is used, like pivot systems. You can also see the total estimated irrigated area for each block.
Keep in mind that the accuracy of the data can vary by region and depends on the quality of the images used. Additionally, the Nelson area is not included, as there are no significant irrigated areas there.
Data supplied by Ministry for the Environment (MfE) licensed under CC BY 4.0.
A comprehensive dataset of Aotearoa river catchments that drain to the sea.
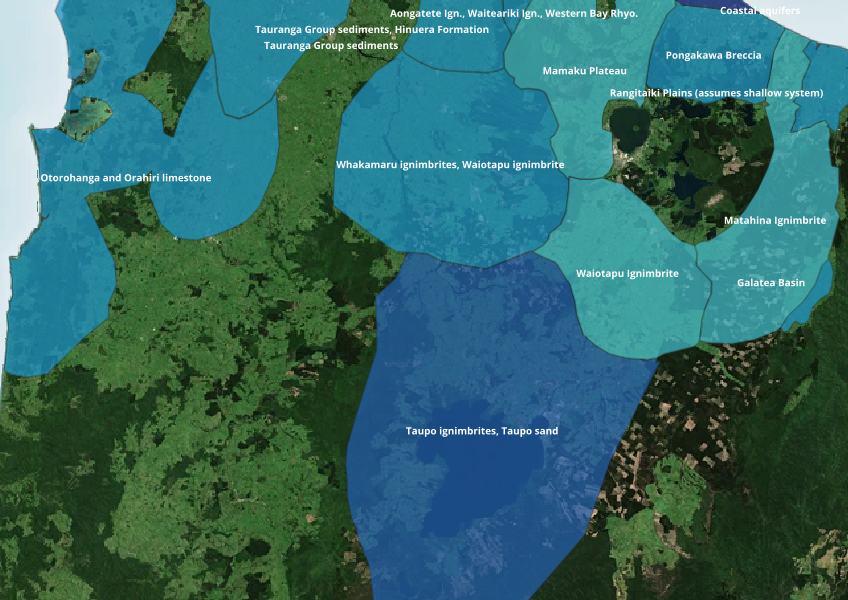
Find out where you might be able to access groundwater in your rohe.
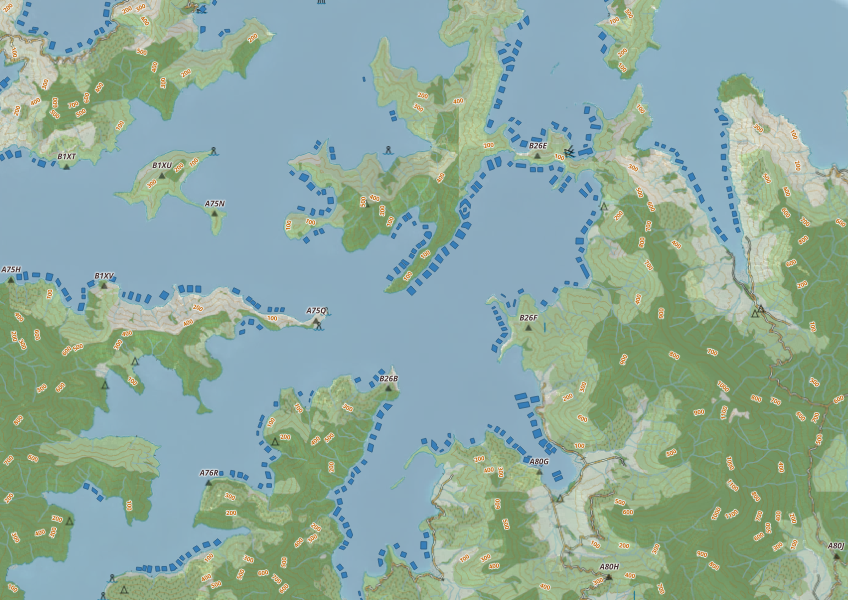
This map shows areas in Aotearoa that are used for aquatic farming.
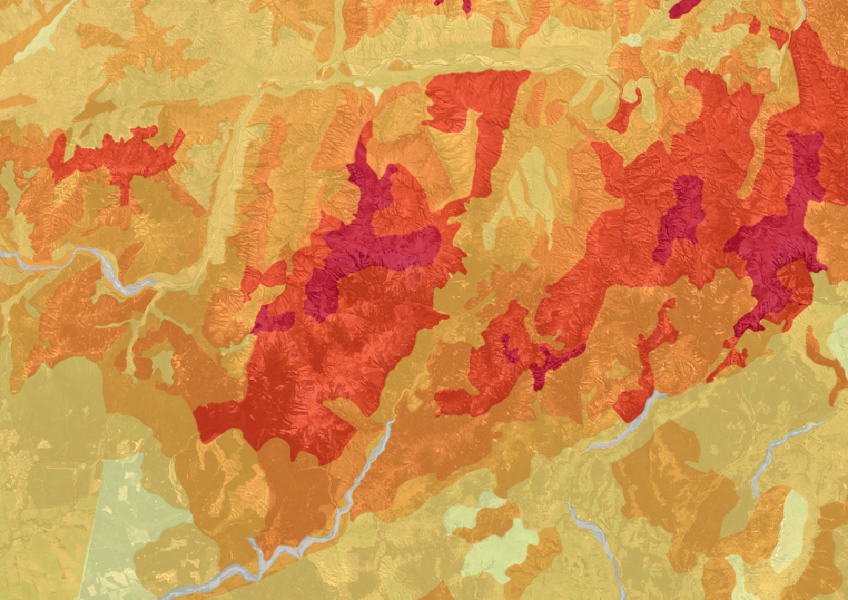
This map shows erosion types and estimated severity across Aotearoa.
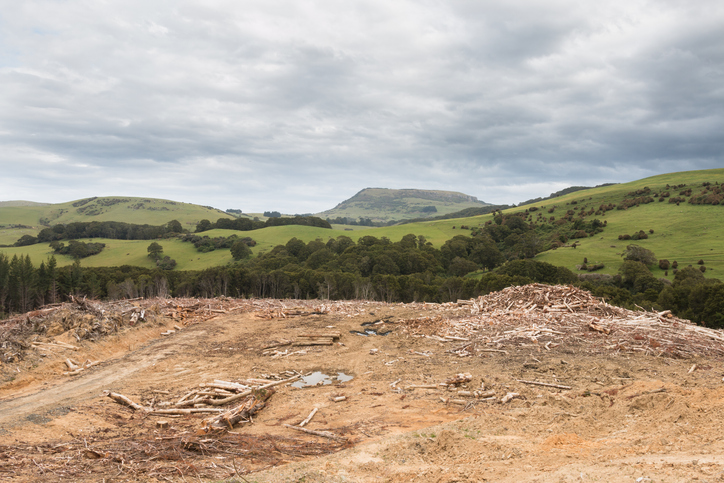
See statistics about deforestation for each local council area.
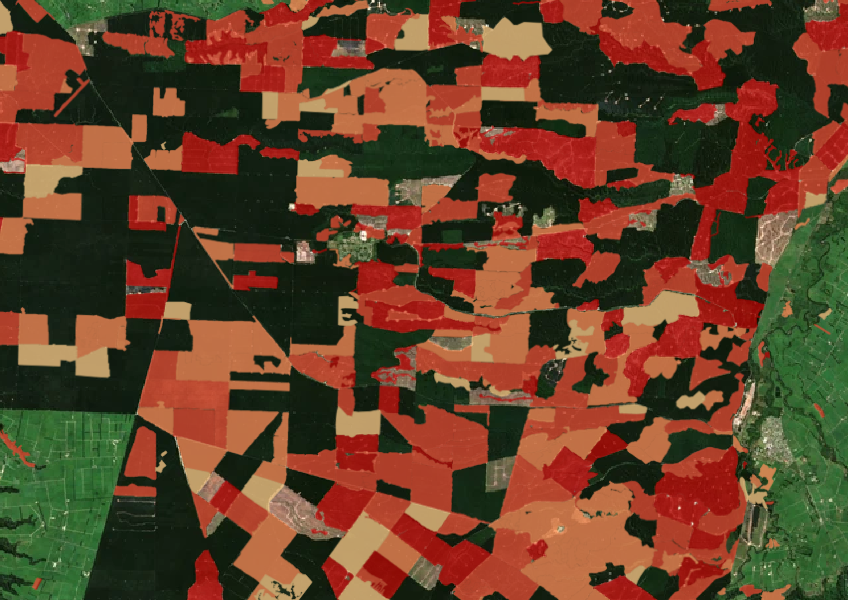
See the extent of forested land cleared between 2008 and 2020 shaded by year.
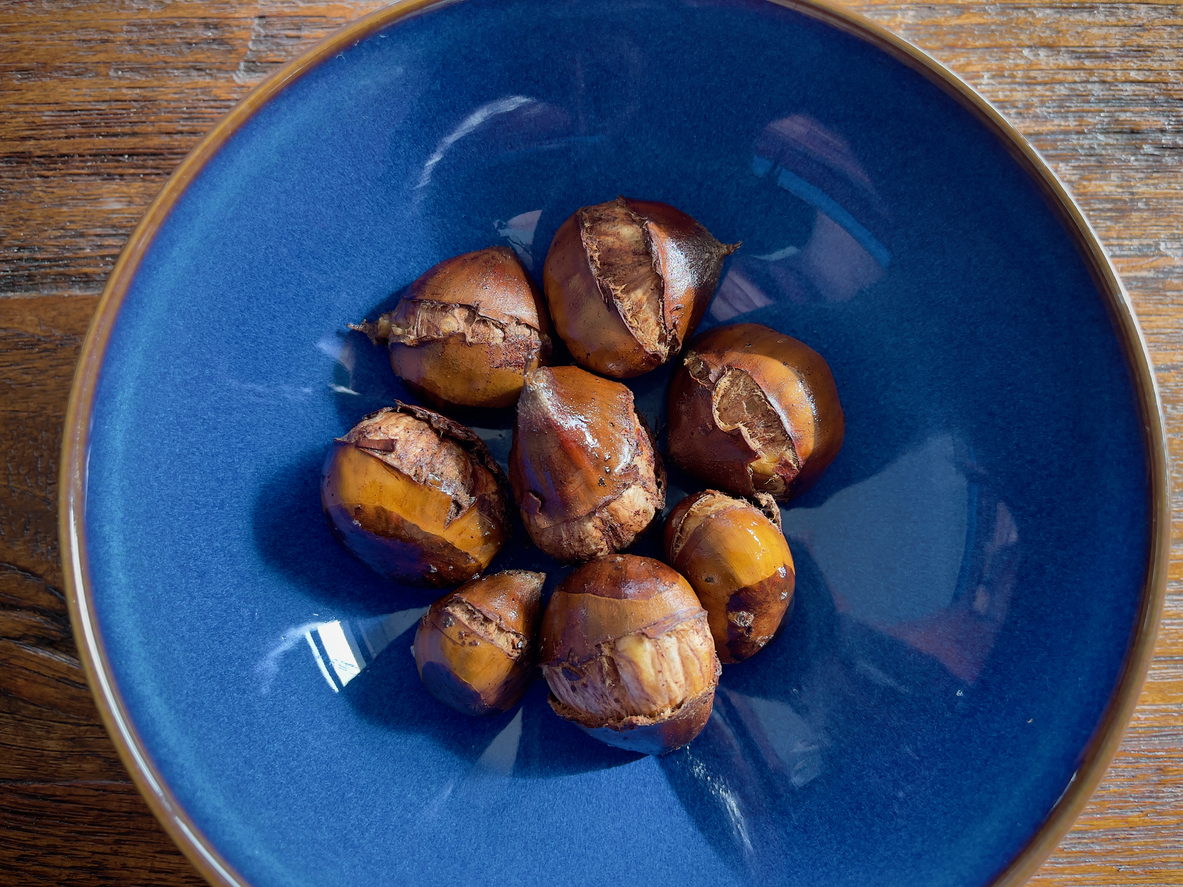
Learn how much chestnuts the whenua in your rohe could produce each year.
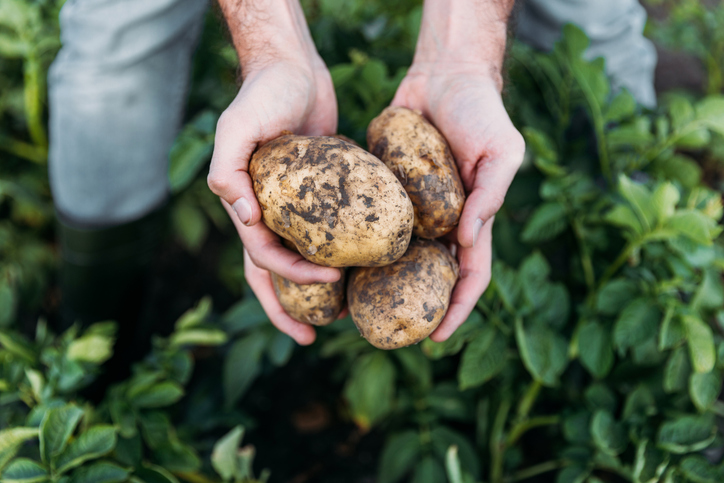
Check how much potatoes the whenua in your rohe could produce each year.
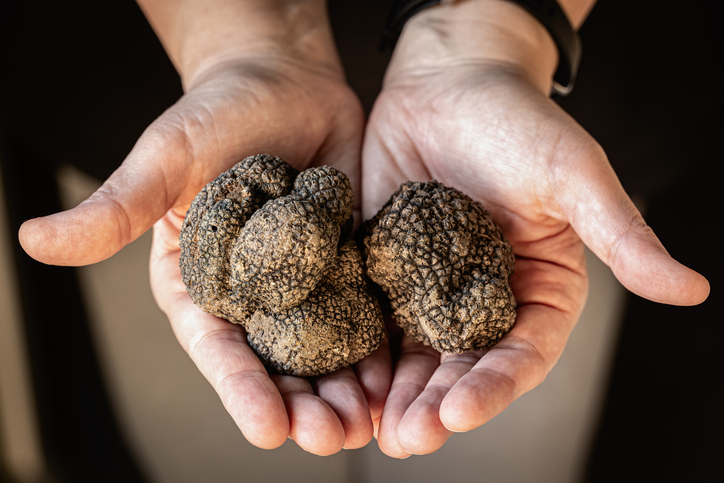
Compare how much truffles the whenua in your rohe could produce each year.
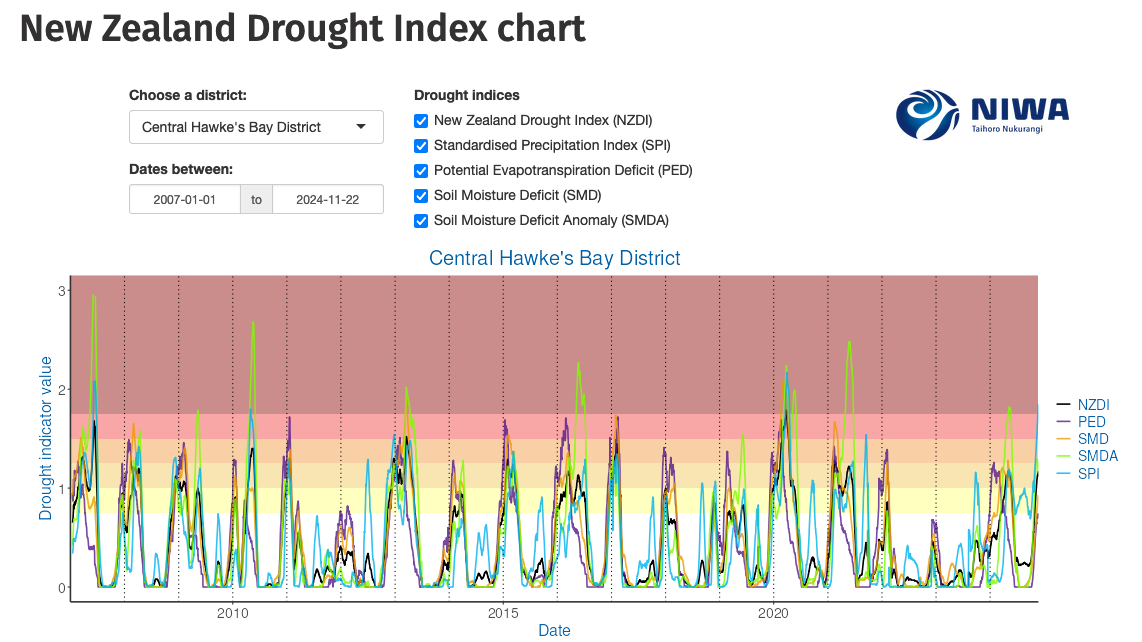
Monitor drought in New Zealand using key indicators and climate data. Access maps and downloads.
Quickly and easily compare farm emissions data for different countries.
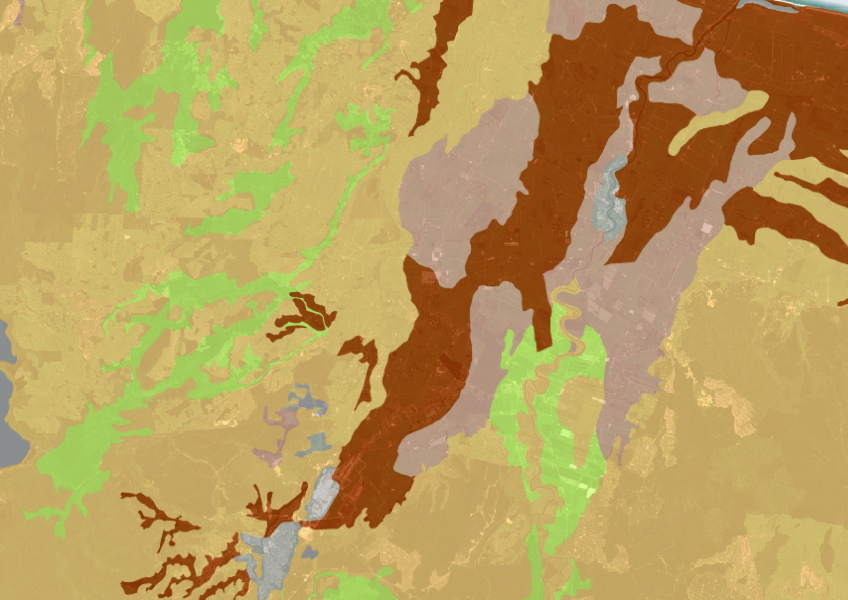
A dataset that estimates soil temperature across the motu.
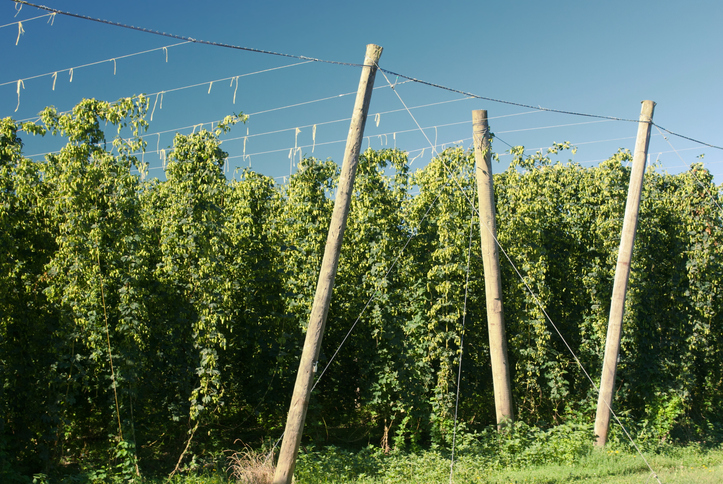
Compare how much hops the whenua in your rohe could produce each year.
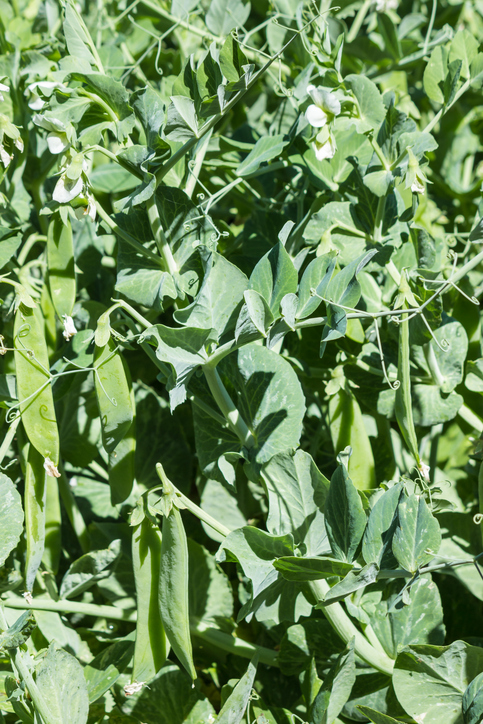
Learn how much peas the whenua in your rohe could produce each year.
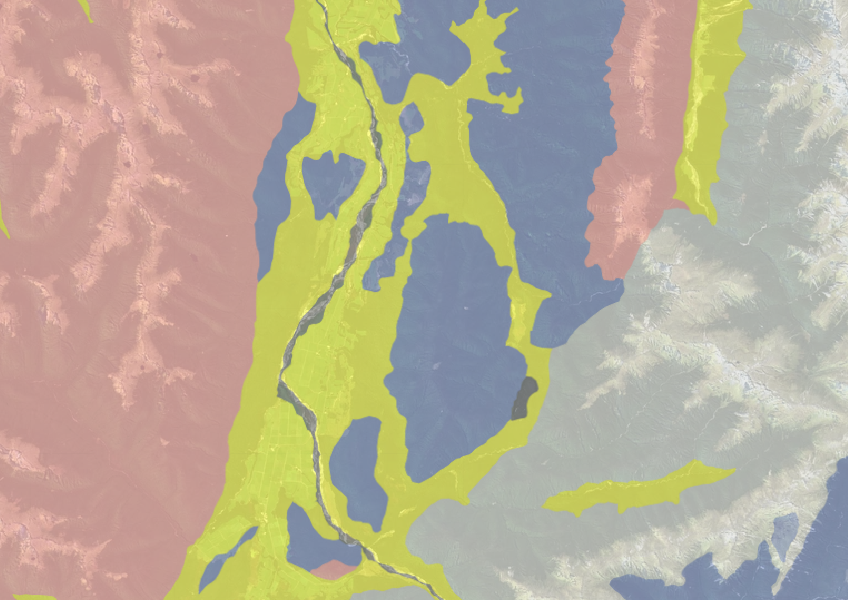
Use the NZLRI rock dataset to understand what type of rock is under your whenua.
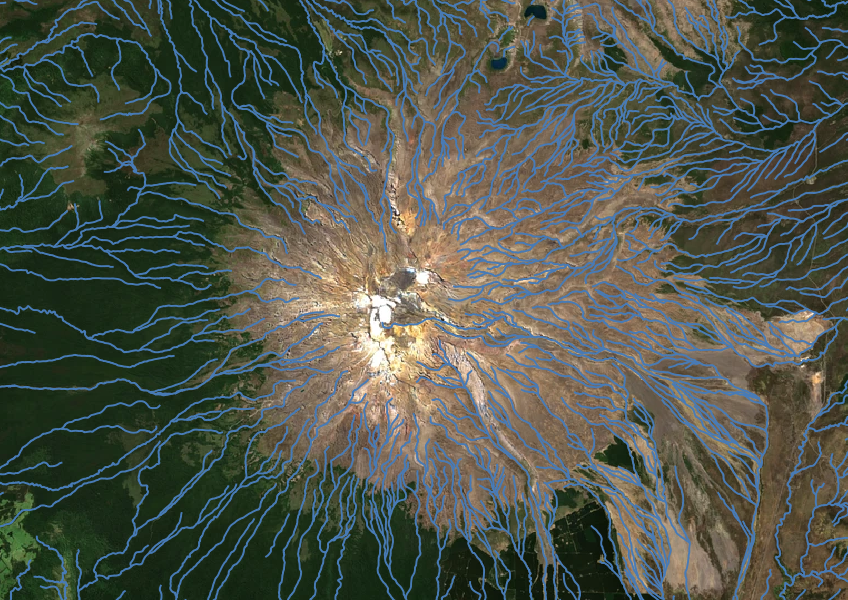
Download a dataset of named and unnamed river lines data for use in your analysis.
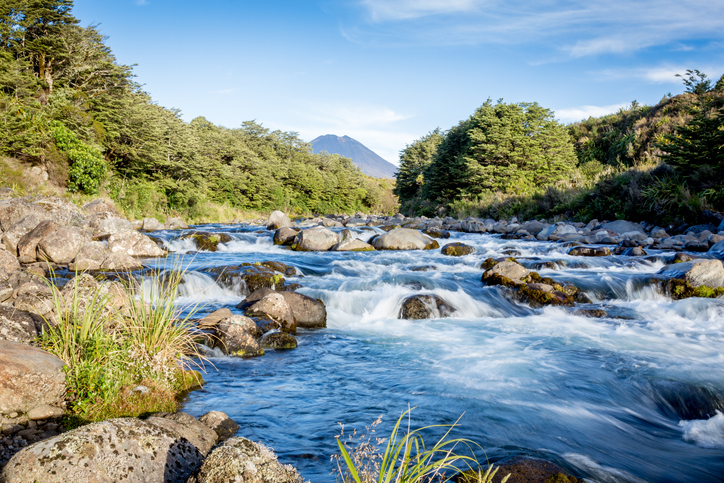
Explore how land use affects soil and water quality across New Zealand catchments.
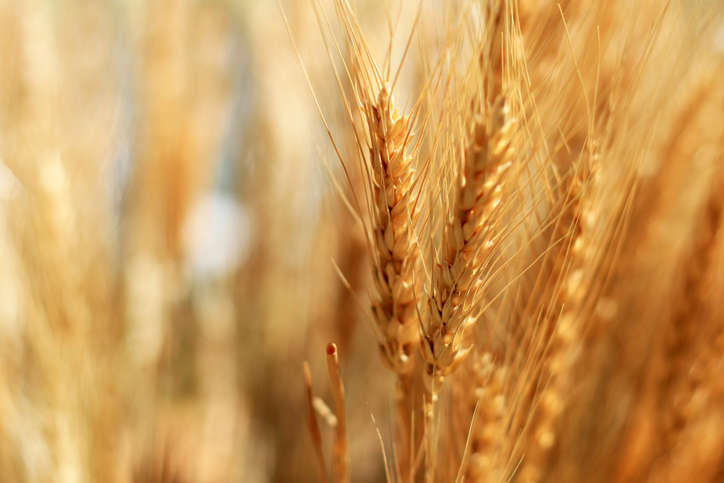
See how much wheat, barley and oats the whenua in your rohe could produce each year.
Discover how much mānuka honey the whenua in your rohe could produce each year.
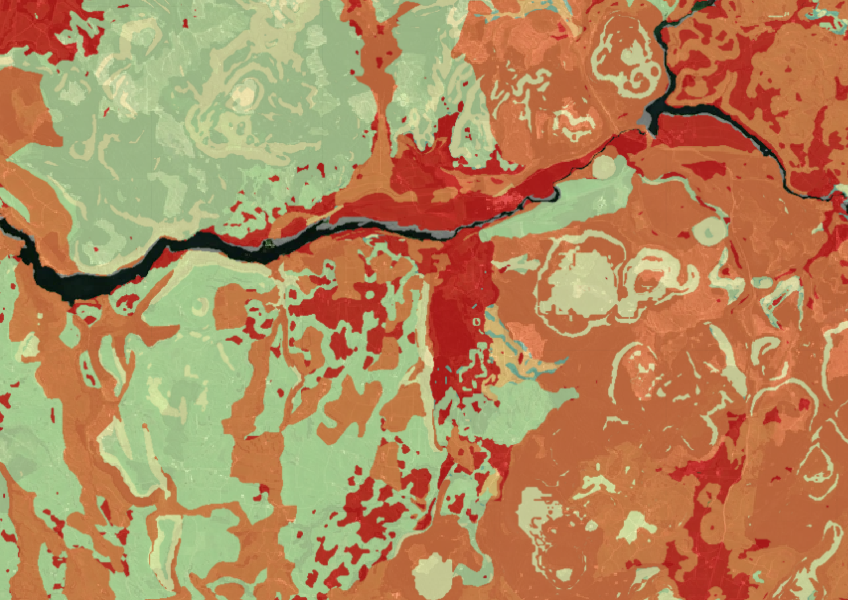
Map showing our remaining indigenous vegetation and its protection status..
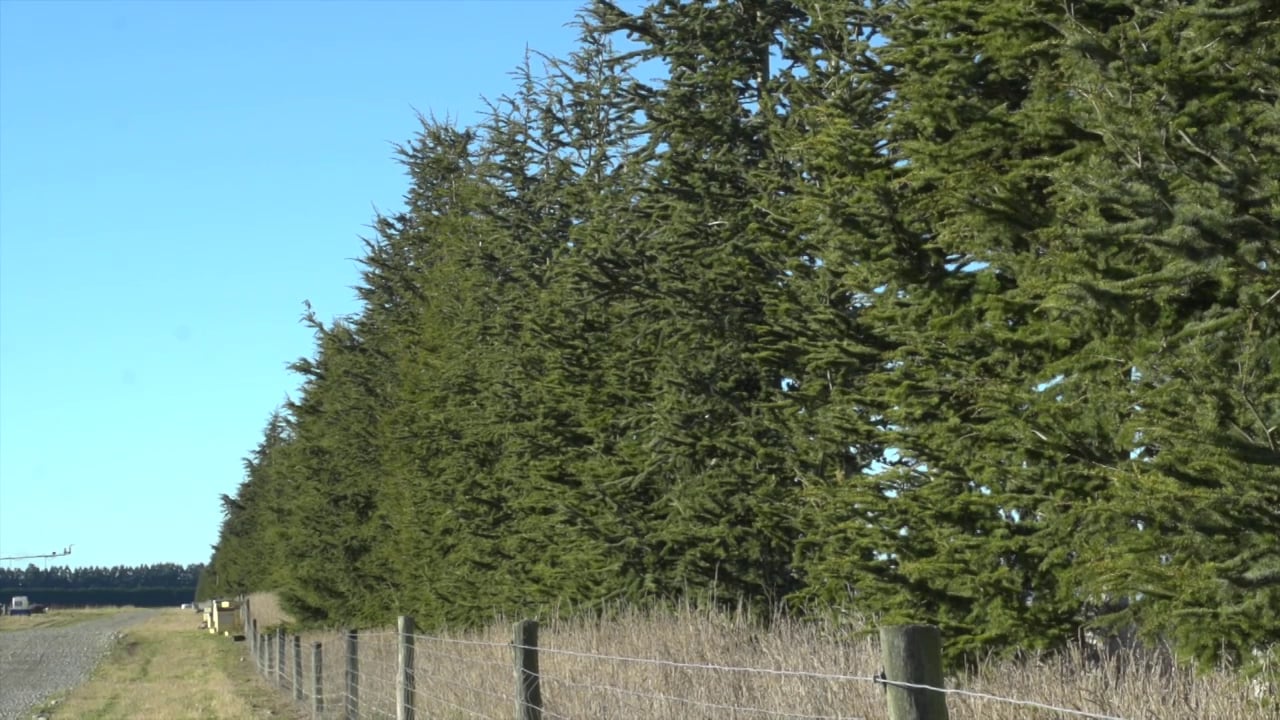
Find out how shelter plantings are improving soil conservation on a Canterbury farm.
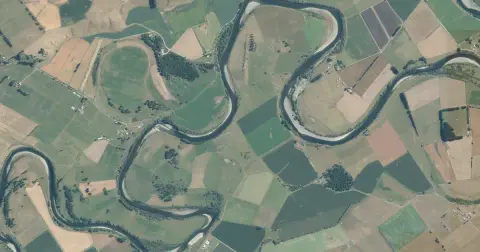
See flood risk maps for your region now and under future climate changes.
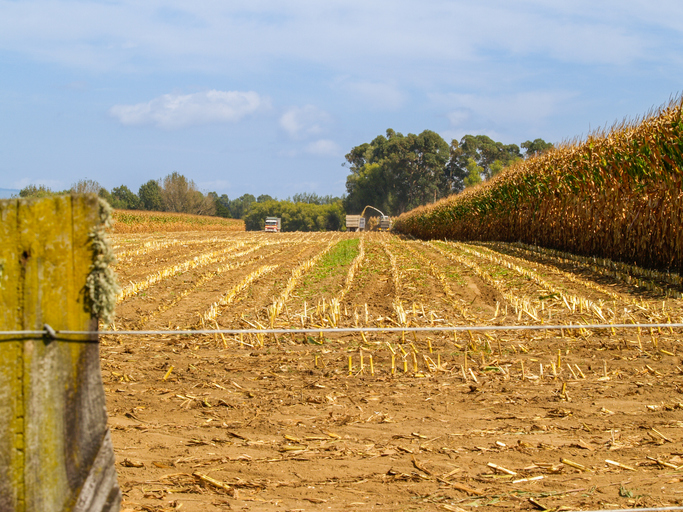
Learn the operating profit grain maize could earn on the whenua in your rohe each year.