Northland Environmental Data Hub
Climate
Biodiversity
Community
Conservation
Water
Access diverse environmental data from Northland, including air, water, and rainfall quality.
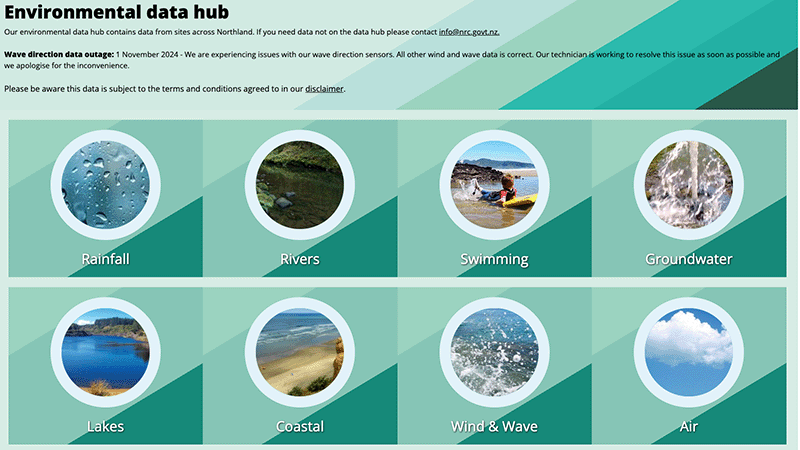
This online map from Taranaki Regional Council shows live readings from monitoring sites across the region, updated every 15 minutes. The readings cover rainfall, river levels, water quality, air quality and groundwater.
Pick a site to see its latest results, or view and export readings for a date range.
Access diverse environmental data from Northland, including air, water, and rainfall quality.
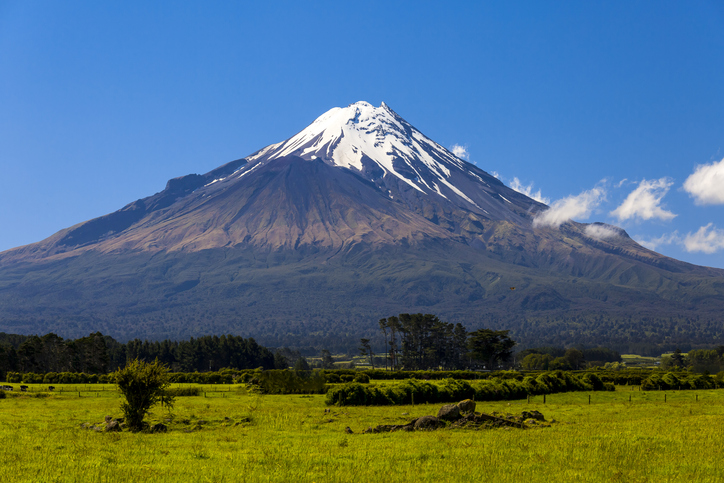
Access monthly and yearly climate summaries for Taranaki from the regional council.
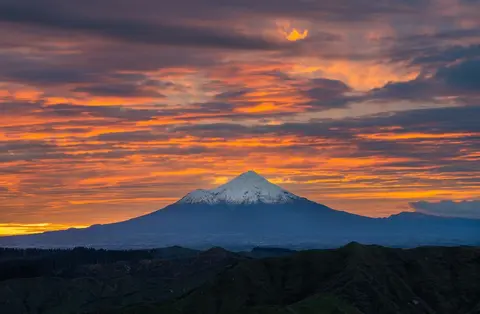
Find out why Taranaki is one of the windiest regions and how its rain spreads through the year.
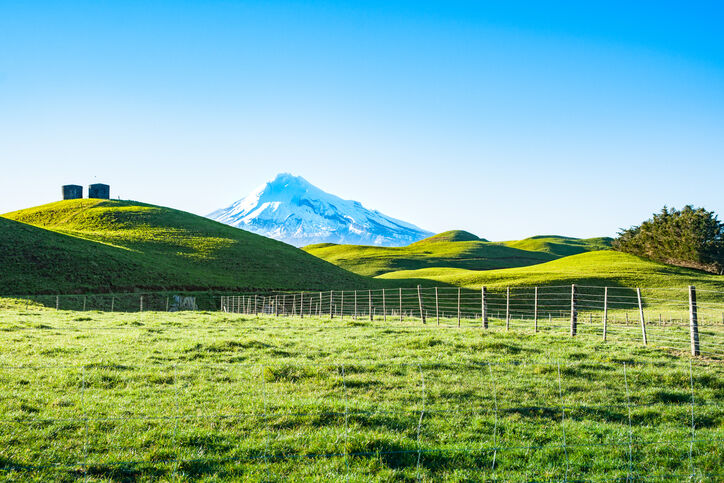
A report produced by NIWA, details climate change impacts and projections for Taranaki until 2100.
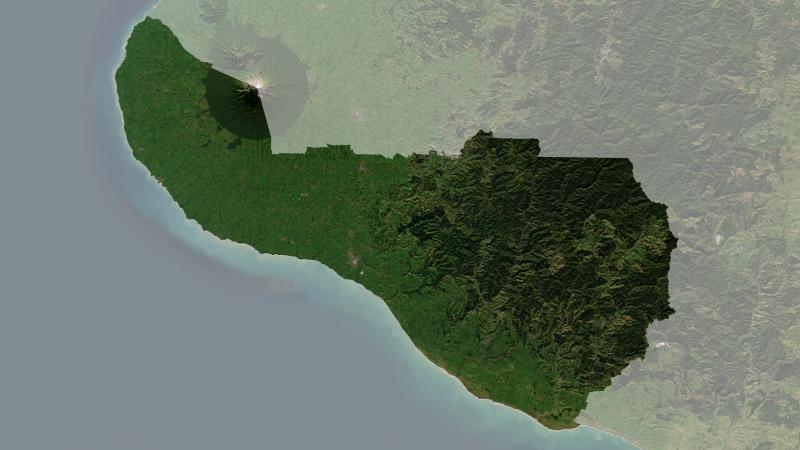
Understand climate event and variability trends for South Taranaki District.
Find data on how climate change affects water in Aotearoa’s rivers and groundwater.
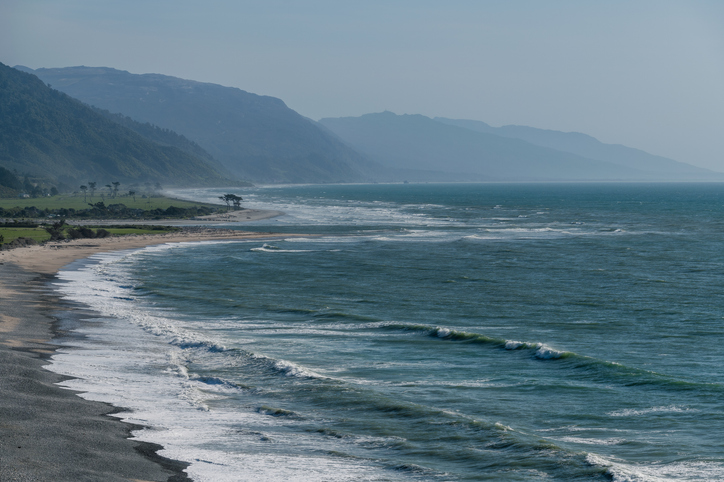
The SOE report shows the West Coast's natural resource trends and areas for improvement.
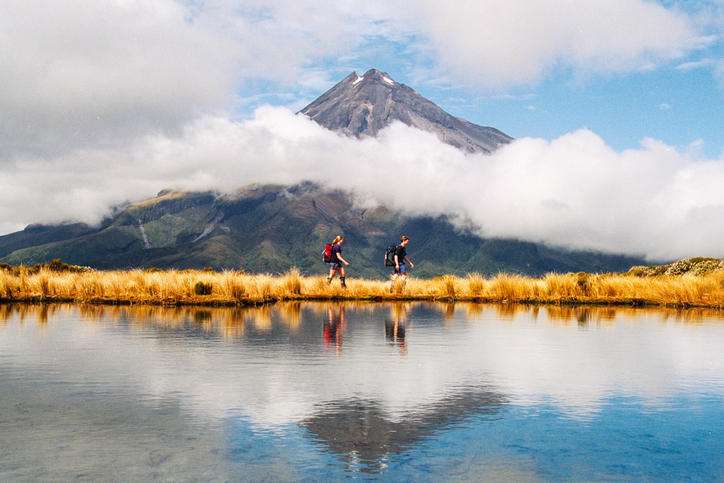
Learn about rules for activities near Taranaki wetlands.
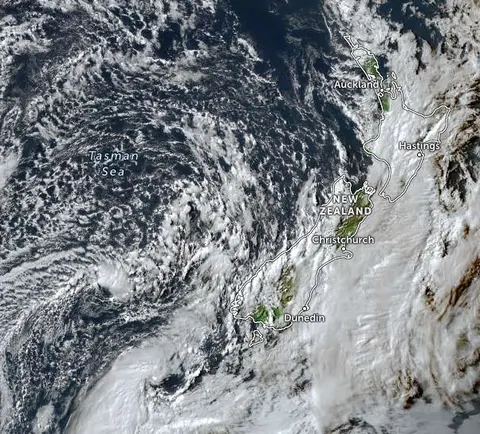
Zoom in on live satellite maps to check weather, floods, fire risk, and land changes in your rohe.
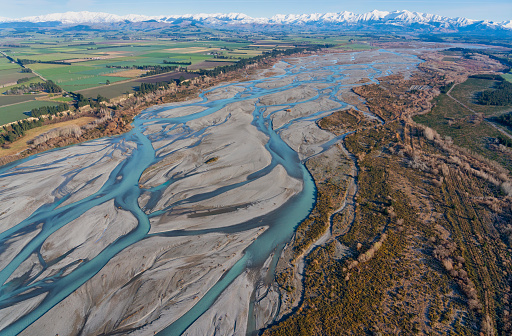
Explore updated climate projections for New Zealand, including rainfall and temperature changes.
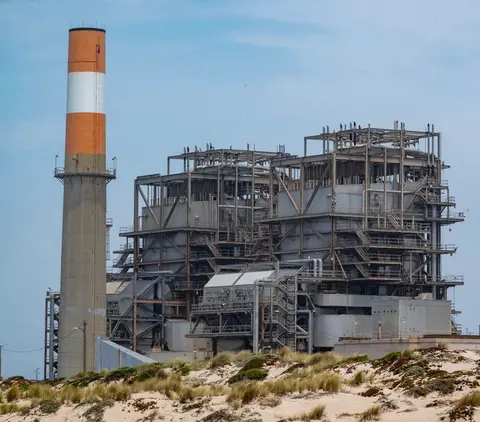
Learn how Taranaki industry can switch process heat from gas to biomass and electricity.

View rainfall data for Northland, showing monthly averages and percentages from gauges.
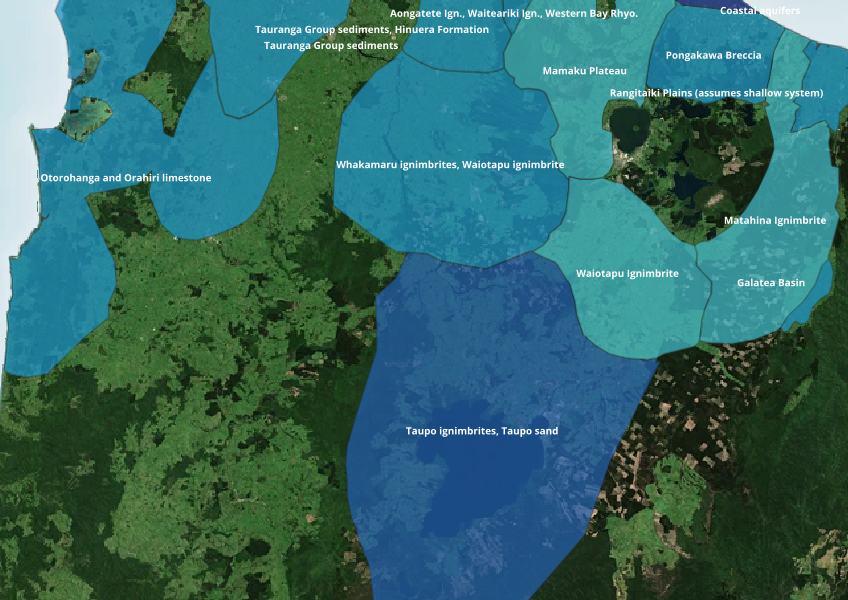
Find out where you might be able to access groundwater in your rohe.
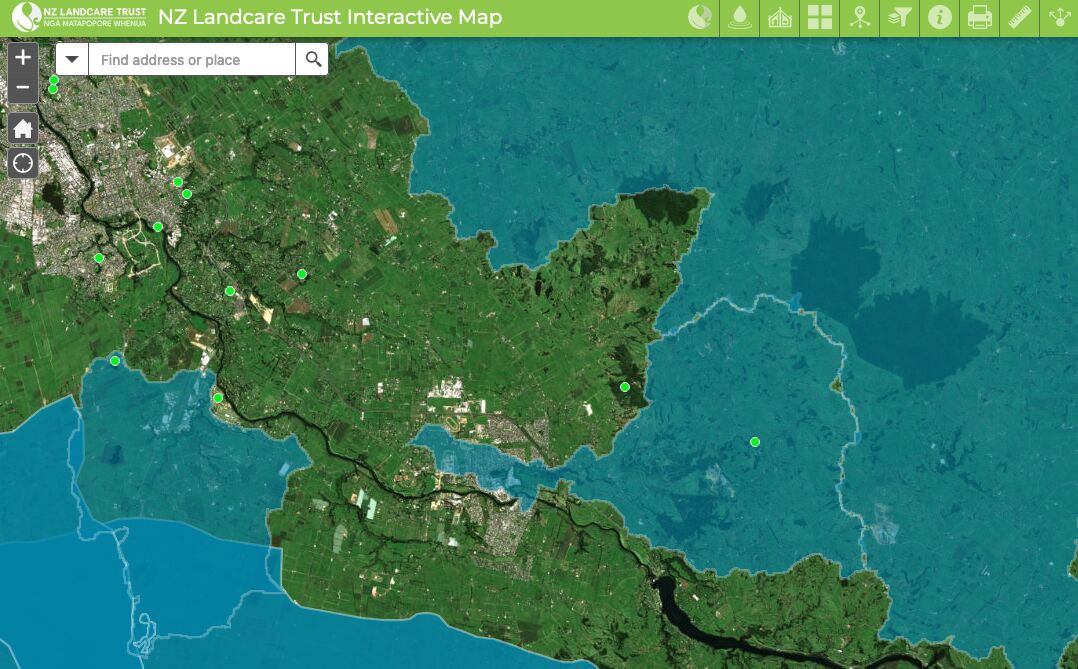
Find catchment and environmental groups and water quality data with this interactive map.
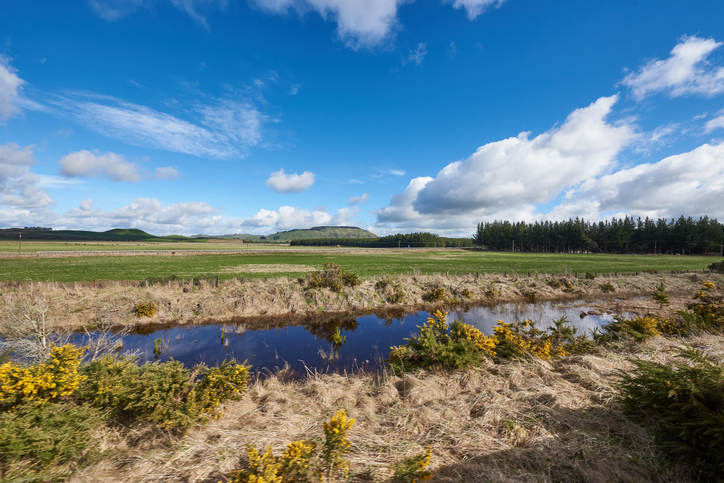
Explore maps showing how livestock density affects water quality in New Zealand rivers.
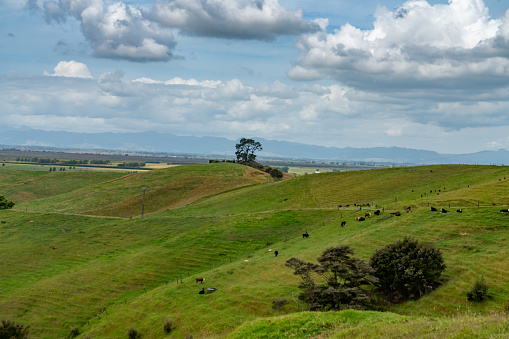
Check the predicted redox state of groundwater beneath your rohe.
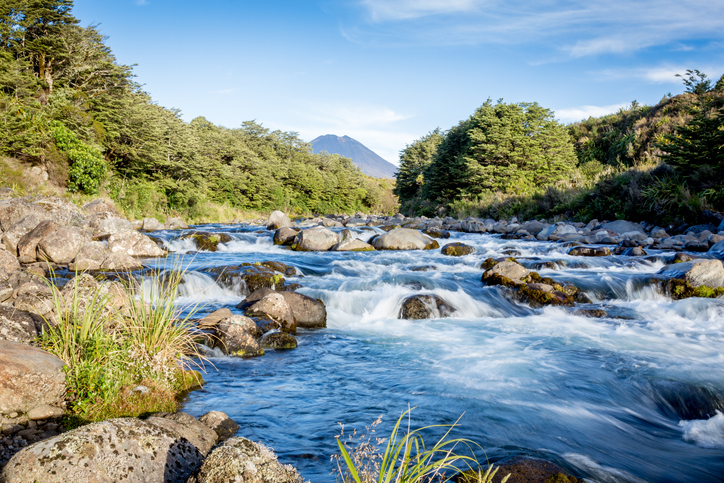
Explore how land use affects soil and water quality across New Zealand catchments.
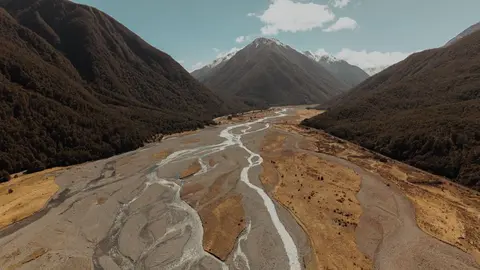
See where river management and flood protection projects are under way.
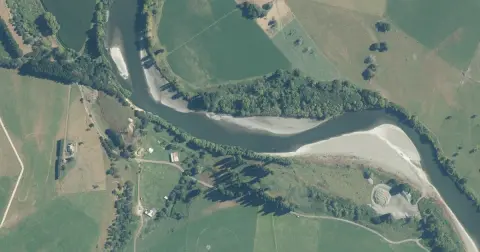
Model how land use changes might influence water quality in your catchment.
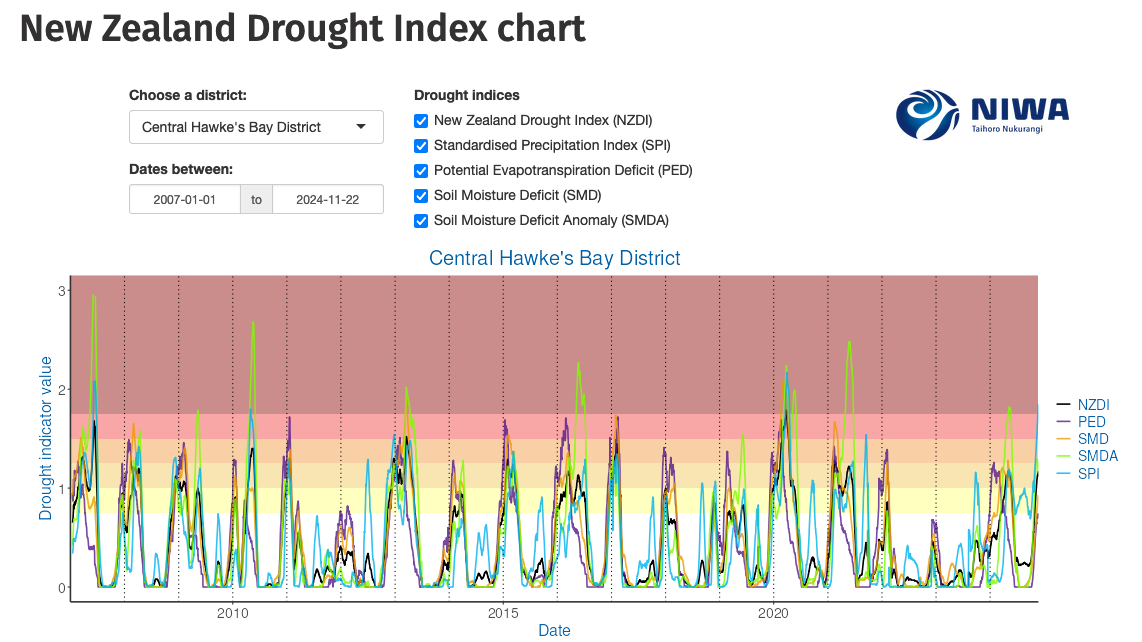
Monitor drought in New Zealand using key indicators and climate data. Access maps and downloads.
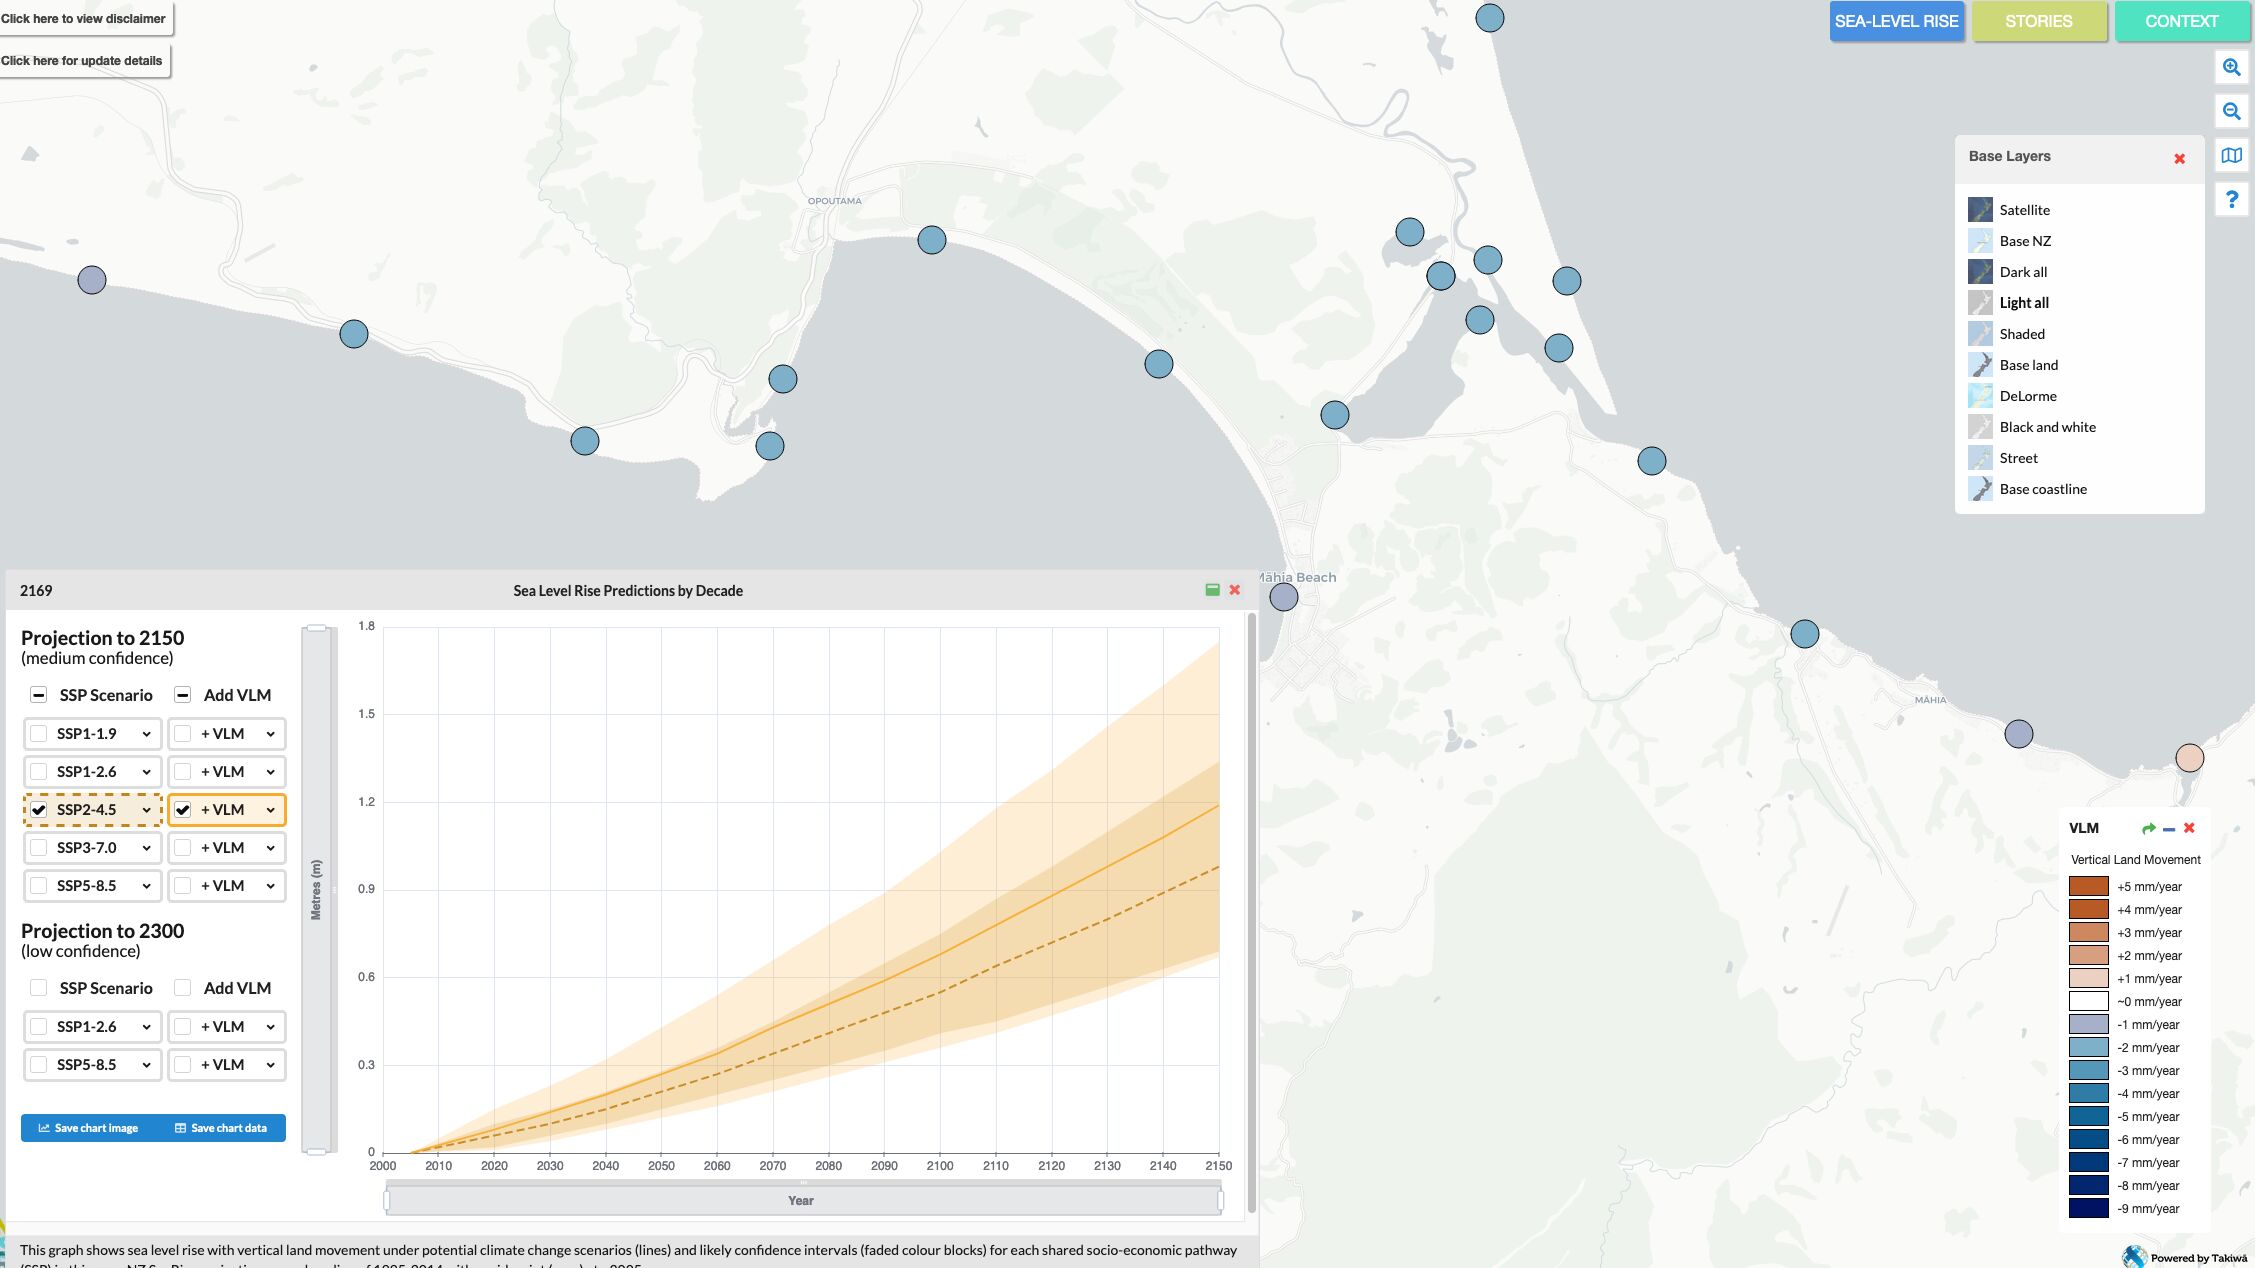
Explore sea-level rise projections for New Zealand’s coasts, with local impacts and maps available.
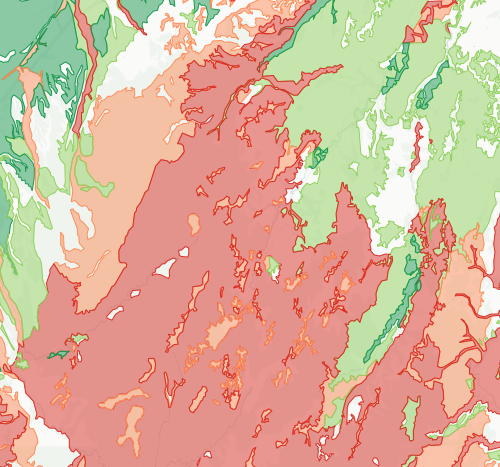
Check how likely nitrogen is to leach through your soil